There are probably very few people in the world who have obtained a PhD in Economics and also obtained a world record in a video game. In my case, that game was World of Warcraft and the record included a number of rank 1 logs that placed me as the second highest ranked mage in the world during 2019 Classic. I am thus in the unfortunate position to care about topics which have next to no overlap or synergy between them.
Yet recently an article caught my attention from both sides. The Economist reported on latest developments in the war in Ukraine, where drone pilots are getting resources allocated via a scoreboard. Points are getting scored by destroying enemy materiel and personnel and the most successful pilots can purchase new drones directly with their points. This is both genius and terrifying.
One of the first things I played were old school shooters like UT99 and Quake 3 Arena. The scoreboard was a powerful motivator back then when it tracked meaningless frags but a scoreboard that reflects someone’s successful commitment to defending their country seems like the mother of all motivators. The system also aligns everyone’s incentives and allocates scarce resources efficiently, which is why it will probably get rolled out elsewhere in the future. That’s the genus part of it. My suggestion would be to skip the terrifying side and to go all in here.
Currently we have drone pilots fighting other drone pilots while competing on scoreboards for more drones. How about we fast forward, skip the fighting in the real world and play StarCraft instead? The next step in the evolution of war is going to be autonomous robots fighting other autonomous robots and that’s pretty much the same thing. So why not do it in the virtual world?
Because South Korea would achieve world domination, obviously. Still, food for thought.
I’m writing this post at a time where I should be writing something else. Unfortunately I’m very bad at keeping my focus and the only way I’ve found to regain it is to get the things out of my mind that occupy it when they shouldn’t. This is one I’ve been sitting on for a very long time.
By now I have a very large collection of unpublished posts. They usually start with a great idea, get worked on for a bit to put them into good shape but eventually I can’t muster the courage to post something. I’m a selective perfectionist and publishing things is topping the list of things that terrify me. I’m publishing this one to work on that, so hopefully you’ll read on. But that’s not the main reason.
The main reason I haven’t published much is something else – my highly diverse interests. Seeing how I use feed-based news sources, what I worry about is people’s tendency to listen selectively to those voices who are highly knowledgeable and specialised. And my problem is that I care about topics which have very little overlap, so posting about passion A might stand out as completely irrelevant for someone who only cares about passion B. I’m not fully sure how the content selection algorithms work but I assume that posting off-topic is not going to make it to the top of other people’s feeds.
For readers it has become more effective to curate one’s own filter bubbles (plural, hopefully) than mixing everything into one feed. If I want to stay current on trade policy, I need to listen to certain voices. If I want to know how the meta in Hunt:Showdown is changing, I’ll need to listen to others. For creators it has become almost mandatory to pick a lane in order to build a public profile that cuts through the noise. Extroverted specialists are rewarded by this, introverted generalists punished. I’m more of the latter.
I have decided to worry a little bit less about what other people might think about my thoughts and ideas and a bit more about getting into the habit of sharing them. Maybe at some point I’ll pick a lane for LinkedIn but for now this will be the space where I’ll publish. Feel free to comment or get in touch. Or just stay a while and listen.
Public access to Midjourney’s text-to-image AI fuels an explosion of creativity
One of my first images created with Midjourney. Let the psychoanalysis begin.
Every once in a while you come across something so amazing that it redefines how you see the world. Often that’s an idea that unlocks pathways to other ideas. On rare occasions it’s a person that’s lived a unique life, proving that something you thought impossible wasn’t actually. Sometimes it’s an experience that gives you a new perspective on your own life. All of these turning points come with a sense of the world becoming larger, of new opportunities unfolding in front of you. The temptation of curiosity then ignites the drive for exploration.
What’s currently happening in AI isn’t new to those who follow the space closely. Images created by OpenAI’s DALL-E 2 and others have been circulating for a while. That’s not the point here. A revolution doesn’t happen when someone shouts a brilliant new idea into a crowd. A revolution happens when people turn around to listen and then take matters into their own hands. That’s what’s currently happening with Midjourney’s AI system. It’s freely accessible in a quick and easy way through their Discord server and boy are people turning around.
My own flying city in the style of Studio Ghibli. Neat.
Yesterday evening at one point over 170.000 online users flooded the AI’s Discord bot with inputs, creating a never ending stream of fantastic, absurd, hilarious, inspiring and most of all new images. That last adjective is crucially important. Nobody has ever seen these images before. Aspects of it, sure, that’s how the AI works but the compositions themselves are novel creations. Dreams made reality with a few simple inputs. If you haven’t already done so – create a Discord account, join the server and watch this happening in real time. The technical details are secondary, it’s the social and economic phenomenon unfolding in real time that is fascinating. This is a moment that will be talked about for a long time.
Apparently I’m an artist now. If I want to be.
It’s not about seeing these images, it’s about creating them
Now you might look at the images I included in this post and think “that’s cool stuff, but I’ve seen cool stuff before – why is this dude getting so excited about a few images”. That was my first reaction as well. We’ve all been flooded by fantastic imagery and suffer daily from countless assaults on our visual cortex. And after all, this isn’t even video. The output of this AI, although fantastic, isn’t the main point. It’s having access to the creative process to get there that’s revolutionary. Let me explain.
The difference between watching someone else’s fantastic creations and creating your own is comparable to listening to someone talk about getting laid versus, well, actually getting laid (not saying that I’d ever place making cool images on the same level as the latter activity but you get the point). It’s this difference that makes people shrug when they see AI-generated images and the reason this didn’t get much traction outside of its niche before. It’s also the reason this is exploding right now. We’ve been handed the keys to the kingdom and the experience is quite hard to describe. As with the other thing, it’s better to just experience it.
An accurate representation of my schedule since the birth of my son.
A breakthrough to a new frontier of human creativity
Okay, calm down there. We’re getting a bit ahead of ourselves here, aren’t we? Well, not really. Have you ever been to a museum, looked at a magnificent painting and thought to yourself “I have so many fantastic images in my head but no way to get them out of there”? After all, not many of us are born with the talent or the time to develop the skills it takes to translate our ideas into physical representations. That excuse doesn’t exist anymore, at least not in the same way. All you need to do now is to type out your dream and watch it getting painted. It’s a fantastic experience that changes the way you think about art forever. However, this is also where things get quite a bit more complicated.
The AI works by interpreting a string of text, which means the keys to the kingdom come in the form of having the ability to describe what you want the image to be composed of in a way that the AI interprets as you intend it to. For example, the previous image is the result of “American McGee’s Alice clockwork world, unreal engine, hyperrealist, –ar 12:19”. I found it amazing in many ways and decided to keep it but it’s nowhere near what I imagined. While it’s easy to get the AI to produce something, getting it to do exactly what you want is extremely difficult. It takes a new skill set. Enter the “AI whisperer”.
Miami beach vaporwave pixel art. Why not.
To create an image that mirrors your imagination you need to learn the AI’s way of understanding human language, at least for now. Alternatively you can spend hours trying to shape an image into what you want it to be by iterating through hundreds of incremental changes. That means you either need skill or time, the latter building the former. Learning from other people’s inputs is the glue that builds this new community, greatly speeds up the learning process and opens a pathway for anyone to turn themselves into an AI artist (hold your pitchforks, art people).
However, you quickly start to reach the limits of your creative vocabulary and a new frontier emerges. The good news is that your imagination isn’t limited by your ability to paint anymore. The bad news is that you’re now limited by your ability to translate your thoughts into text. Don’t get me wrong, that is a giant leap because it takes your body completely out of the equation. However, it also places you immediately in front of new challenges. If you want your image to look like the one by that great artist you saw once, well, you need to remember what the name of that person was and add it to your query (you can hear the collective sigh of the art people right there, can’t you?). If you want to create someone that’s truly new you’ll be busy for a while.
A house overlooking the Mediterranean Sea. At least what the AI suggests it should look like.
Free your mind (and your schedule)
All you are now limited by is your mind. And the time you can spend to provide feedback to the AI. And your knowledge of art, artists, styles, techniques, production methods and other useful details to improve the precision of your queries. And your English skills because inputs in other languages are even less precise. And your knowledge of technical commands like that “–ar 12:19” string I used above, which is used to tell the AI that I want an image with a 12:19 aspect ratio. Why exactly that? I have no idea, I just copied it from some dude who made a pretty image in portrait mode. You see where I am going with this. All of this is fun to explore and play around with but it’s also a new skill set, one that an artist is considerably better positioned to acquire in a reasonable amount of time.
Nevertheless, many entry barriers to the creation of beautiful imagery have just been removed. Just as the availability of free online education increased the chances of discovering the next Einstein and free sharing of audio and video increased the chances of finding the next Mozart, free public access to this technology increases the chances of discovering the next Van Gogh. Who knows, maybe future generations will one day study the revelatory incantations of FortniteGIGACHAD#1845.
The origin of music according to Midjourney.
Enjoy the ride but fasten your seatbelts
Public access to creating digital art is a welcome side effect of advancements in AI. The bigger picture is that we’re all in for a wild ride. Midjourney’s CEO David Holz predicts that we might have an XBox with an AI to dream up entire games in less than ten years, video created in similar fashion in less than two. In comparison to that, building similar tools to write reports (or blog posts) seems like a fly on the windshield. If your job involves turning ideas, data and knowledge into text you might want to consider that the production process could change dramatically.
Holz is also mindful to point out that we don’t understand the technology’s humanistic implications. It is no accident that you see only positive images on Midjourney’s Discord server and I sincerely hope we never find out what we’re missing out on. I don’t think there has ever been a better practical example for the argument that any technology can be used for good and for bad. His point goes far beyond the concrete example I am picking but the conclusion is similar: we need to advance with caution.
Get ready to ride the wave.
What remains in the end is pure excitement. Being able to translate the images of your dreams into reality feels like exploring a world you are building at the same time. When (not if) this tech masters another dimension and if (not when, unfortunately) access is granted to the public it will trigger an explosion of creativity and content not seen since Gutenberg’s printing press. Sounds absurd? Don’t forget that there is a historical reference point to support this claim. People were once granted inexpensive access to a version of this technology that could only place one pixelated block at a time. It became the most successful videogame in history.
Last Saturday I had the pleasure to talk to the two legends Farsh and Sascha on their podcast “Deep“, a series of conversations between two outstanding minds on a journey to deeper meaning. Their podcast can best be summarized in their own words, translated from German with DeepL:
We – that’s Sascha and Farshad – welcome you on our little website to our podcast Deep. A friendship that has accompanied and enriched us since 2012 through various places like Brussels, Afghanistan and Berlin all the way to our joint podcast adventure. What has grown in many exciting experiences in the “real” world can now blossom in the digital space. Our podcast format reflects this ongoing journey: exciting, deep conversations paired with a huge joy for the superficial and trivial. To enjoy life with a childlike curiosity, to enjoy this life with all means of art and to feel our exchange in the highest, accessible degree of freedom. We would like to share this with you and hope, of course, that you enjoy our podcasts. If not, well then. Then we do, as Sascha (and partly full Assi Toni) it always to say: Always on!
We spoke about my life before and after quitting my previous passion (video games), strategies for mental stamina (meditation) and what Humboldt and Astronauts have in common. If you speak German and have some time on your hands, make sure to check out Sascha and Farshad’s podcast.
Last week I was fortunate to attend a fascinating award session organized by the United Nations Conference on Trade and Development (UNCTAD) and the Academy of International Business (AIB). I am honored that the third paper of my dissertation, MNE and Where to Find Them: an Intertemporal Perspective on the Global Ownership Network was selected among the top 5 nominees for the best young academic research work on international investment and development. Jeremy Clegg and Amelia Santos-Paulino did a fantastic job on the organization and moderation, creating a stimulating atmosphere for discussion of the participants’ results and ideas for future research. James Zhan, session chair and director of UNCTAD’s Division on Investment and Enterprise, guided the session while connecting from a G20 event in Italy. The top 5 nominations were:
The Indirect Effect of Import Competition on Corporate Tax Avoidance – Baptiste Souillard, Université Libre de Bruxelles (Winner)
Overcoming institutional voids in the home country for internationalization: Effectiveness of market and non-market strategies for Indian MNEs – Rishika Nayyar, FORE School of Management, Rajdeepa Maity, O.P. Jindal Global University
Belt and Road Initiative and Cascading Innovation in China’s Domestic Railway Ecosystem – Yang Gao, HEC Montréal
Multichain strategies and economic upgrading in global value chains: Evidence from Kenyan horticulture – Giovanni Pasquali, University of Manchester, Aarti Krishnan, University of Manchester
MNE and Where to Find Them: an Intertemporal Perspective on the Global Ownership Network – Philipp Großkurth, WIPO
Although I did not win the award I am happy to have been among the finalists and look forward to the proposed follow-up by UNCTAD. See you at the World Investment Forum!
Published as Aus dem Moore, N., P. Großkurth and M. Themann (2019). Multinational Corporations and the EU Emissions Trading System: The Specter of Asset Erosion and Creeping Deindustrialization. The Journal of Environmental Economics and Management 94, 1-26.
If anyone asked me what the single most important lesson was that I learned from my PhD it would be this: if the question is not important then the answer doesn’t matter. I’m sure Nils and Michael would agree.
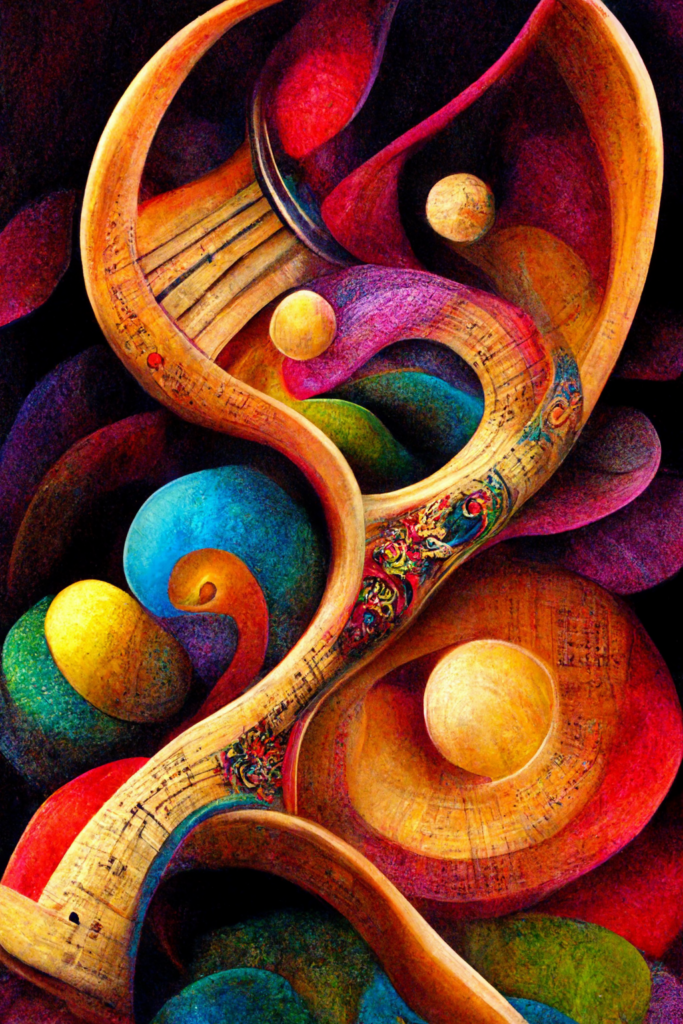
Condensed to its essence the result of the paper is this: Very much in line with the extant empirical literature, we find that until now, claims of a substantial industrial relocation caused by the EU ETS that would manifest itself in the erosion of European assets and, consequentially, emissions leakage, seem to be overstated.
In fact, Tangible Fixed Assets (in log) between treatment and control group follow differing paths after the introduction of the EU ETS in 2005. The paper uses propensity score balancing to ensure the similarity of treatment and control group, employs a wide range of robustness checks and discusses both the assumptions and the more nuanced findings in detail.
Abstract:
This study seeks to investigate the causal effect of the EU Emissions Trading System (EU ETS) on firms’ holdings of fixed assets as an early indicator of industrial relocation, exploiting installation level inclusion criteria of the regulation. To single out companies with particularly low relocation costs, global multinational enterprises (MNEs), we identify ownership structures for the full sample of EU ETS-firms. Matched Difference-in-Differences estimates provide robust evidence that contradicts the specter of an erosion of European asset bases. Baseline results for the manufacturing sector indicate that the EU ETS led to an on average increase of treated firms’ asset bases of 12,1%. However, for a particular subgroup of MNEs, this increase is a mere 2.1%. For these companies, the EU ETS may have induced a shift in investment priorities.
Published as Großkurth, P. (2019b) Dynamic Structure – Dynamic Results? Re-estimating Profit Shifting with Historical Ownership Data. Ruhr Economic Papers 811, RWI 6/2019.
The second important lesson that I learned from my PhD was that one should prioritize based on expectations. In practice that means two things. On the positive side, on should invest time into projects that have a large expected payoff (with is often the case for projects with a rather low probability of success, the “moon shots”). On the negative side this means making damn sure that a crucial assumption that holds the entire paper together does not fail easily. Or that a problem with potentially massive repercussions gets investigated with priority.
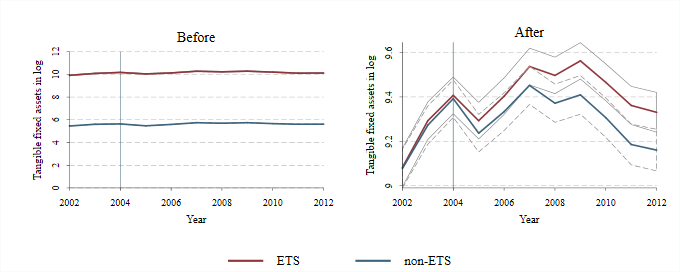
The second paper of my dissertation digs into the details of the “constant ownership assumption”, which is made by many empirical papers on MNE. Although it’s neither likely nor convincing to assume that business structures don’t change over time, making this heroic assumption is a great deal easier than working through the alternatives. Many researchers simply did not have access to the necessary data to do it in any other way either. Fortunately (or unfortunately, looking back at my own publication output) I did have access to this data. The main problem can be seen in the following figure:
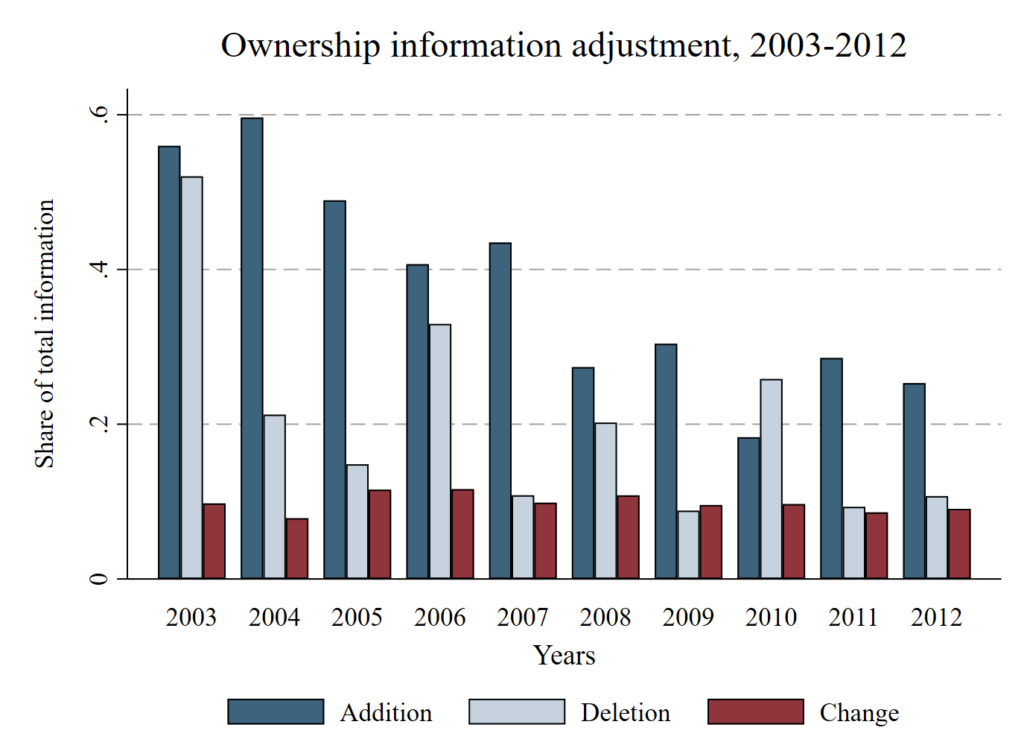
The structural data is nowhere near constant. It changes in every year at an average rate of around 9 percent. As one would expect. For the panel this means that the share of data that fulfills the assumption of constant ownership is practically nonexistent in later years:
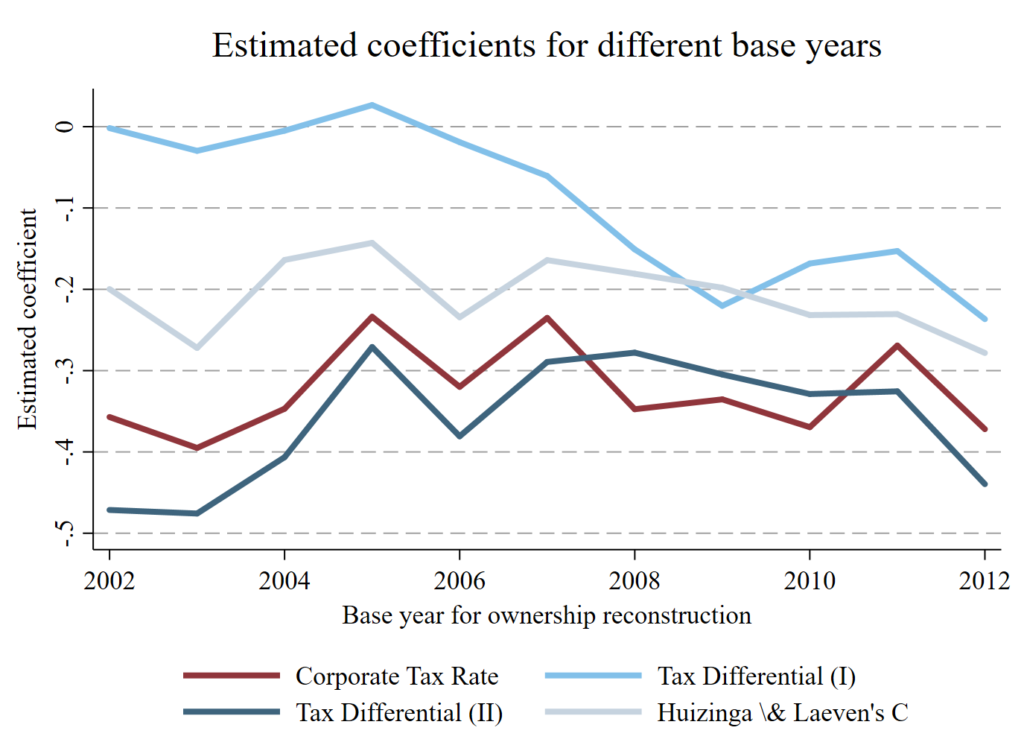
What does this mean in practice? I investigated some simple estimations of profit-shifting and found that the coefficients can change if the underlying sample is changed based on the ownership data structure.
Future research on MNE could benefit from additional robustness checks that take varying ownership structures into account, because this effect might be of different relevance for different questions. As can be seen above, different indirect measures of profit shifting have different sensitivities to changes of the structural data. This could be a problem in other studies, but does not have to be.
What is a problem is that this was the first paper to check an assumption that an entire stream of the literature is built upon.
Abstract:
Ownership structures of multinational enterprises are commonly assumed to remain constant over time, both due to a lack of easily accessible panel data and to facilitate empirical analyses. This paper discusses the validity of this assumption and assesses its relevance in the context of profit shifting. A new method of reconstructing historical ownership information in Bureau van Dijk’s ORBIS database reveals a highly dynamic environment. The validity of the assumption collapses with increasing panel length; ownership structures are rarely constant over time. Moreover, about 9 percent of firms with observed ownership data change owners in each year. The relevance of the assumption is tested by re-estimating indirect measures of profit shifting for selected benchmark samples. Assuming ownership structures as constant has a strong impact on sample composition, adding almost 29 percent of additional observations compared to historical ownership data. In the context of profit shifting, estimates based on constant ownership data are found to be larger in absolute magnitude compared to estimates based on historical ownership data.
Published as Großkurth, P. (2019a) MNE and where to find them: an Intertemporal Perspective on the Global Corporate Ownership Network. Ruhr Economic Papers 825, RWI 10/2019.
The main lesson from the third paper of my dissertation is that complexity does not have to be complicated. The paper proposes a new way of visualizing MNE (Multinational Enterprises) ownership structures in the form of ownership maps, investigates MNE structure and strategies and describes the evolution of the global ownership network. In hindsight I packed a few things too many into this paper, which I am attempting to remedy here by splitting it up into several posts.
Part 1) Ownership maps
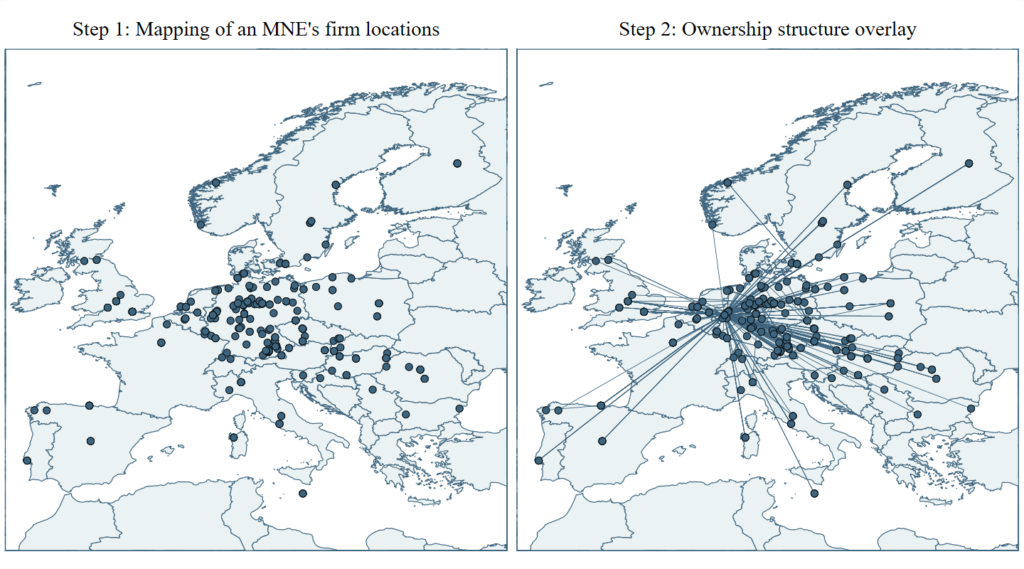
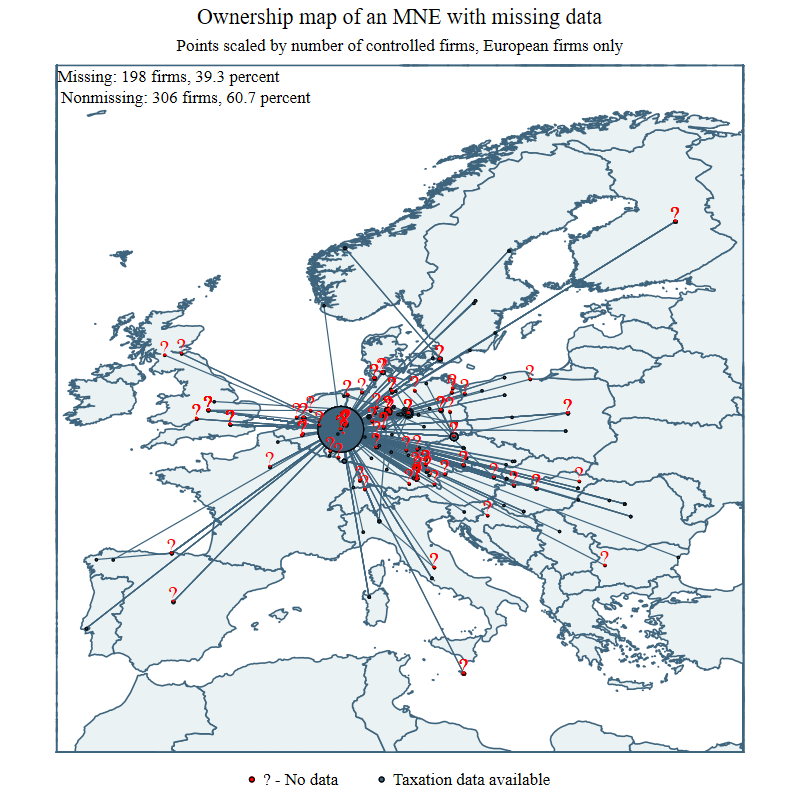
I have a hard time understanding things that I can’t visualize. MNE, however, are extraordinarily complex entities. Every attempt to print them becomes a negotiation between clarity and accuracy. For example, the image below on the left side prints all firms connected in one (!) MNE onto a map of Europe according to their geographic location. Since there is no aggregation of any kind, multiple firms in the same location disappear on top of each other – the visual impression sacrifices some clarity.
However, full accuracy is needed for the second step: the overlay of ownership information. This is essentially an entity-relationship-diagram of the firm-level data printed on top of the previous image. Each line connects two firms whenever one firm owns another. The result is an intuitive visualization of the MNE’s ownership structure, which can then be used for further visual analysis.
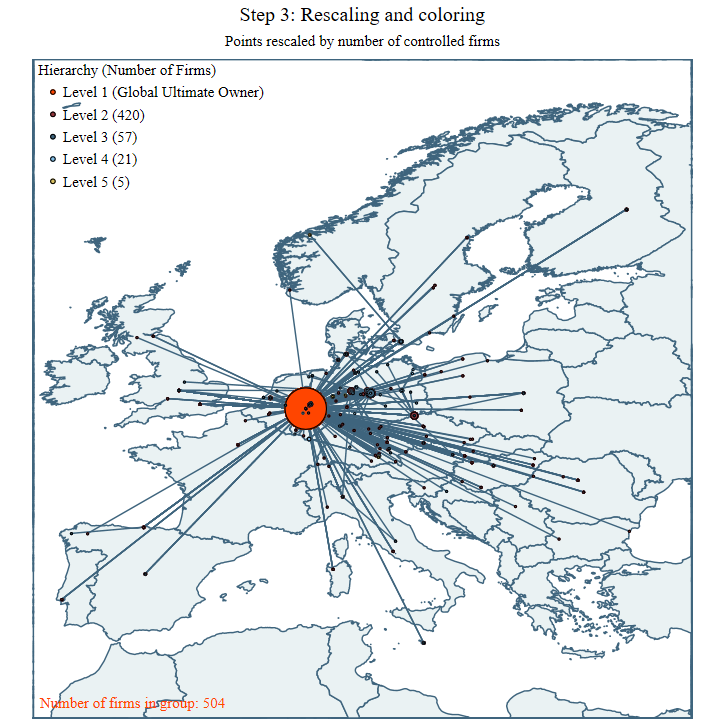
The figure can be further enriched with additional data; pretty much anything that’s available on any level of the MNE. One option shown below is to scale each point according to the number of firms that are connected by it. This representation allows for the visual distinction of regional hubs and headquarters, but pretty much anything is possible.
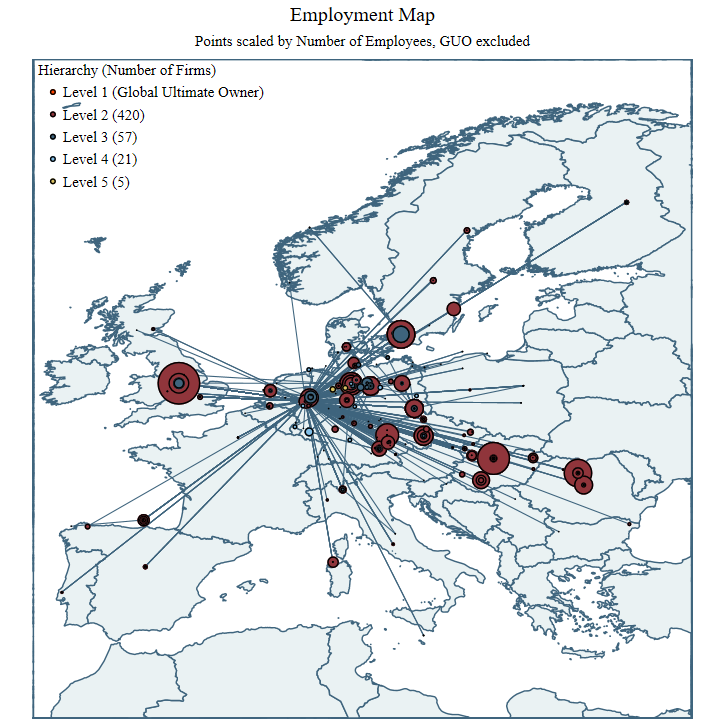
For example, scaling the points by a different variable, the number of employees per company, reveals the employment profile of a company.
The possibilities for these visualization are only limited by the availability of data, but even that might be valuable information in some cases:
Turns out for many of these firms data on taxation was not available. Even more information could be displayed in the same figure through a color gradient of the points and lines, line thickness, and certainly through the application of some kind of aggregation.
Ownership maps simplify MNE to a level where it becomes possible to understand them better. It was a great journey to work on this.
Abstract:
This paper introduces a simple procedure to construct ownership maps in Stata, uses a new method to map the development of the global network of multinational business groups over time and investigates the development of core components of the network. Based on Bureau van Dijk’s ORBIS database, a full panel of ownership structures from 2000-2018 is reconstructed. The data is subjected to a descriptive analysis and subsequently used to identify key locations within the network. Ownership structures are used to identify outliers in the network even in the absence of financial data on the firm level. The identified locations largely overlap with results in the literature, but also point towards previously overlooked destinations. The aggregate ownership network at the country level is used to provide an intertemporal perspective on countries’ development paths within the global network of multinational companies and sheds new light on MNE’s expansion paths.
Published as Großkurth, P. (2019a) MNE and where to find them: an Intertemporal Perspective on the Global Corporate Ownership Network. Ruhr Economic Papers 825, RWI 10/2019.
The second post in this series digs deeper into the structure and characteristics of the global ownership network. The data extraction and preparation process for this paper was extensive, drawing upon the lessons learned in the previous two papers. In a nutshell I extracted the entire ownership network once more, this time during a research visit at the Centre for International Environmental Studies of the Graduate Institute Geneva. I reconstructed the data from 2000-2018 with a base sample of 27.710 million firms, once again reconstructing the ownership connections with a bottom-up approach.
Part 2) Control and Connectedness
The result is a unique dataset which grants fascinating insights into the global economy. Well, those parts that made it into the ORBIS database, at least. The data opens up many interesting avenues for research.
For example, each firm is listed with a specific code number which includes the 2-digit ISO country code. Aggregating the network to the country level and taking into account the direction of the ownership links then allows to investigate which countries host firms who control firms in other countries (below, on the Y-axis) and which ones host firms controlled by firms located in other countries (below, on the X-axis).
While the US and Japan are primarily outward-oriented, Germany exhibits a more balanced profile. Furthermore, most high-income countries are well connected in both directions. Openness is key to growth and development in a strongly connected global economy.
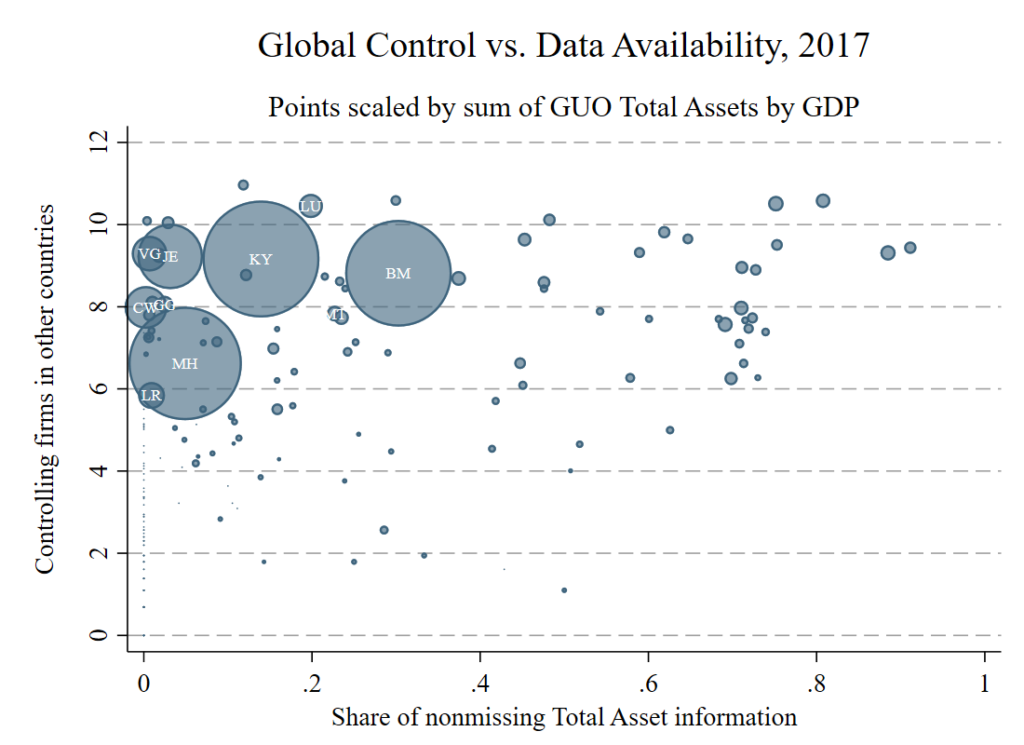
Another insight on the country level can be gained by investigating the outliers of the global ownership network. The figure below keeps the same Y-axis out outward form control, but scales the size of the points by the ratio of controlled assets to GDP and replaces the X-axis with a measure of data availability. The main insight is that a massive amount of assets (relative to their real economy) is controlled from a few small economies (The Cayman Islands, Bermuda, The Marshall Islands). However, what we can see is likely a lower bound because for most firms in those countries data availability is low. Coincidence?
Published as Großkurth, P. (2019a) MNE and where to find them: an Intertemporal Perspective on the Global Corporate Ownership Network. Ruhr Economic Papers 825, RWI 10/2019.
The third post in this series investigates MNE growth and strategy, highlighting organizational preferences and spatial growth over time. There are common patterns: the average MNE is small, organized as flat as possible, and connects few countries. Internationalization, however, can happen in very different ways. As long as an MNE has subsidiaries in only a few countries, both flat and deep hierarchical structures are employed. On average and for larger numbers of connected countries, MNE seem to converge towards flatter hierarchiers. Growth, on the other hand, happens either very slow (expansion – the creation of new subsidiaries) or extremely fast (combination – M&A and the like).
Part 3) Growth and Strategy
Is it possible to accurately print the time series data of 329.376 MNEs? The next figure tries to do exactly this, overlaying the expansion paths of all MNE in my dataset both in terms of the countries and the firms they connect. To make the average pattern visible, I reduced the opacity of the individual lines into the single digits. The way Stata handles overlapping lines then brings out the average. Probably not a perfect solution, but good enough to understand what’s going on in this massive dataset.
Both panels of the figure also highlight the large amount of fluctuation in the data – if a line jumps unreasonably from one year to the next it’s fairly safe to assume that something fundamental has happened to either the firm or the way the firm is captured in the database. The results suggest that most MNE stay small and regional, a point that the next figure will clear up even further.
A key insight here is that the average MNE is much smaller than their reputation suggests and that MNE grow faster in terms of the number of connected firms than they do in terms of the number of connected countries.
In each year firms enter the dataset and firms leave it, which explains the difference between the panels in the figure above. On the left side averages are calculated in each year of the database. Due to the large turnover of firms, the average size of an MNE – both in terms of the connected firms as well as the connected countries – seems to stagnate. If the data is rearranged, however, to align firms according to the number of years that we observe them in the dataset, the picture is strikingly different. Firms grow in both dimensions and they grow considerably. The fluctuations at the end of the figures are explained by input lag on the left side and reduced data availability of firms with long time series on the right.
However, while this suggests that firms grow over time it’s important to keep in mind the ever present process of creative destruction. Most firms aren’t observed continuously and data availability grew over time. Taking this into account, the next figure highlights the massive turnover of firms.
In this case what’s true for firms in general also seems to be true for MNE in particular. The data also points toward a process of group size consolidation over time, but that’s a story for another time.
Aside from these more general conclusions the dataset also allows for an in-depth investigation of the MNEs’ organizational structures and strategies. The figure below highlights the relationship between group size, connected countries, and hierarchy depth (the number of links between the global ultimate owner and the furthest removed subsidiary in the group). What’s immediately striking is how slow the average rate of geographical expansion is. The Y-Scale is at a factor of about 1/10 of the X-Scale, meaning that MNE generally increase the number of subsidies in a country they are active in before they move to another. Likewise, MNE favor flat hierarchies over deep ones (aside from a few outliers who only operate in relatively small numbers of countries), a result that doesn’t seem to change all that much with increasing group size.