
Published as Großkurth, P. (2019a) MNE and where to find them: an Intertemporal Perspective on the Global Corporate Ownership Network. Ruhr Economic Papers 825, RWI 10/2019.
The main lesson from the third paper of my dissertation is that complexity does not have to be complicated. The paper proposes a new way of visualizing MNE (Multinational Enterprises) ownership structures in the form of ownership maps, investigates MNE structure and strategies and describes the evolution of the global ownership network. In hindsight I packed a few things too many into this paper, which I am attempting to remedy here by splitting it up into several posts.
Part 1) Ownership maps
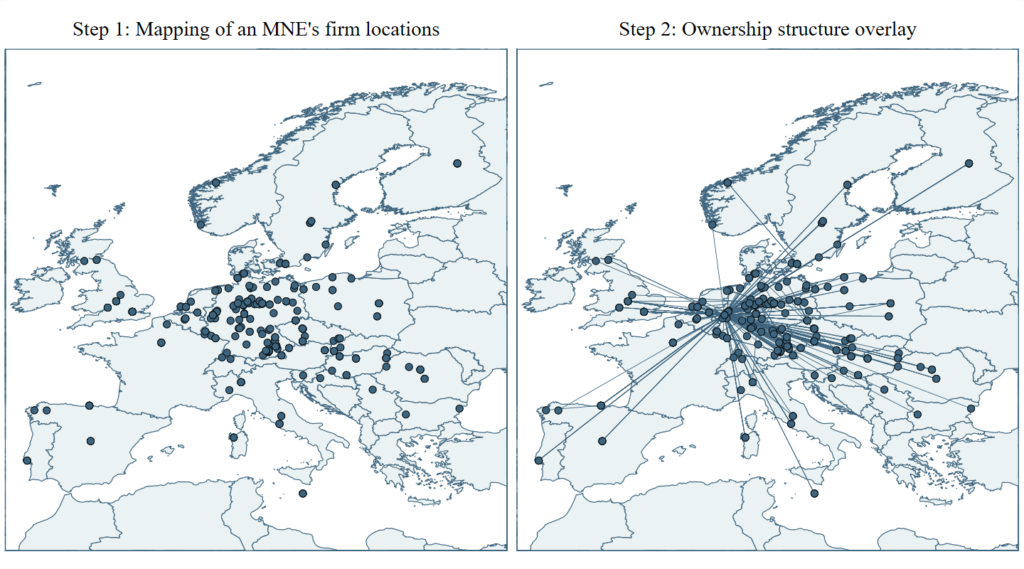
I have a hard time understanding things that I can’t visualize. MNE, however, are extraordinarily complex entities. Every attempt to print them becomes a negotiation between clarity and accuracy. For example, the image below on the left side prints all firms connected in one (!) MNE onto a map of Europe according to their geographic location. Since there is no aggregation of any kind, multiple firms in the same location disappear on top of each other – the visual impression sacrifices some clarity.
However, full accuracy is needed for the second step: the overlay of ownership information. This is essentially an entity-relationship-diagram of the firm-level data printed on top of the previous image. Each line connects two firms whenever one firm owns another. The result is an intuitive visualization of the MNE’s ownership structure, which can then be used for further visual analysis.
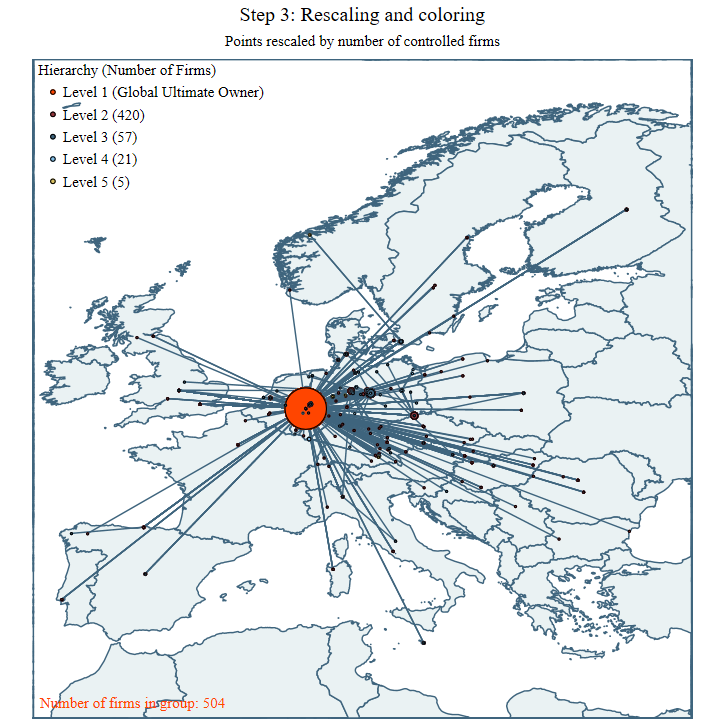
The figure can be further enriched with additional data; pretty much anything that’s available on any level of the MNE. One option shown below is to scale each point according to the number of firms that are connected by it. This representation allows for the visual distinction of regional hubs and headquarters, but pretty much anything is possible.
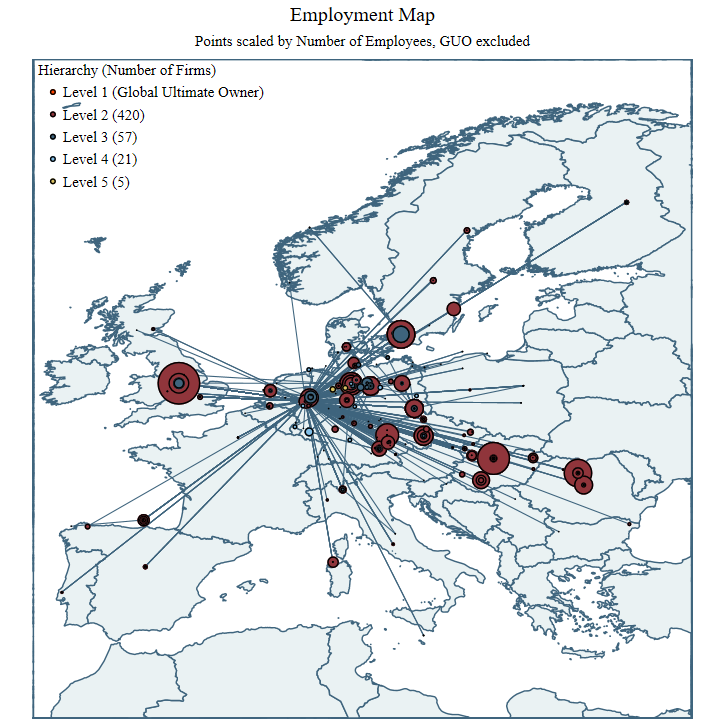
For example, scaling the points by a different variable, the number of employees per company, reveals the employment profile of a company.
The possibilities for these visualization are only limited by the availability of data, but even that might be valuable information in some cases:
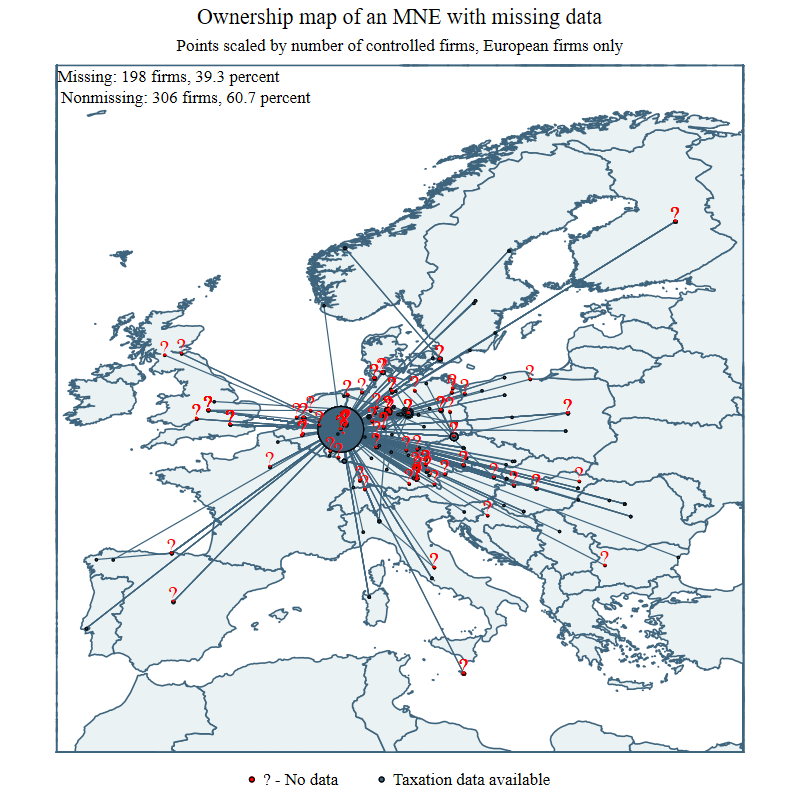
Turns out for many of these firms data on taxation was not available. Even more information could be displayed in the same figure through a color gradient of the points and lines, line thickness, and certainly through the application of some kind of aggregation.
Ownership maps simplify MNE to a level where it becomes possible to understand them better. It was a great journey to work on this.
Abstract:
This paper introduces a simple procedure to construct ownership maps in Stata, uses a new method to map the development of the global network of multinational business groups over time and investigates the development of core components of the network. Based on Bureau van Dijk’s ORBIS database, a full panel of ownership structures from 2000-2018 is reconstructed. The data is subjected to a descriptive analysis and subsequently used to identify key locations within the network. Ownership structures are used to identify outliers in the network even in the absence of financial data on the firm level. The identified locations largely overlap with results in the literature, but also point towards previously overlooked destinations. The aggregate ownership network at the country level is used to provide an intertemporal perspective on countries’ development paths within the global network of multinational companies and sheds new light on MNE’s expansion paths.