Published as Großkurth, P. (2019a) MNE and where to find them: an Intertemporal Perspective on the Global Corporate Ownership Network. Ruhr Economic Papers 825, RWI 10/2019.
The second post in this series digs deeper into the structure and characteristics of the global ownership network. The data extraction and preparation process for this paper was extensive, drawing upon the lessons learned in the previous two papers. In a nutshell I extracted the entire ownership network once more, this time during a research visit at the Centre for International Environmental Studies of the Graduate Institute Geneva. I reconstructed the data from 2000-2018 with a base sample of 27.710 million firms, once again reconstructing the ownership connections with a bottom-up approach.
Part 2) Control and Connectedness
The result is a unique dataset which grants fascinating insights into the global economy. Well, those parts that made it into the ORBIS database, at least. The data opens up many interesting avenues for research.
For example, each firm is listed with a specific code number which includes the 2-digit ISO country code. Aggregating the network to the country level and taking into account the direction of the ownership links then allows to investigate which countries host firms who control firms in other countries (below, on the Y-axis) and which ones host firms controlled by firms located in other countries (below, on the X-axis).

While the US and Japan are primarily outward-oriented, Germany exhibits a more balanced profile. Furthermore, most high-income countries are well connected in both directions. Openness is key to growth and development in a strongly connected global economy.
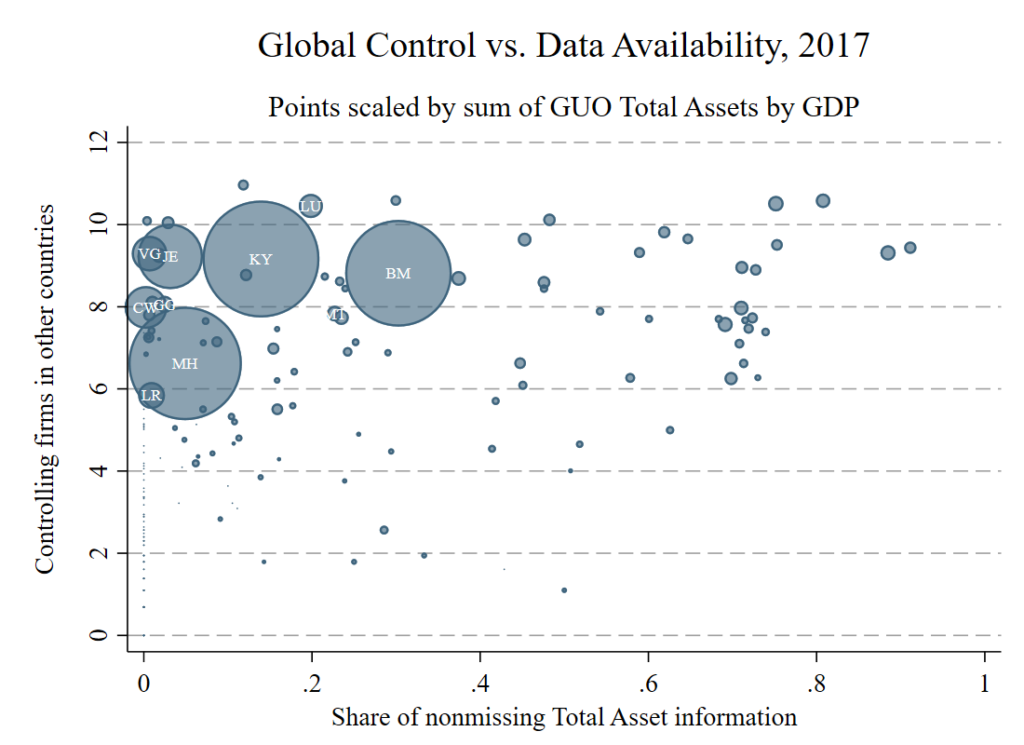
Another insight on the country level can be gained by investigating the outliers of the global ownership network. The figure below keeps the same Y-axis out outward form control, but scales the size of the points by the ratio of controlled assets to GDP and replaces the X-axis with a measure of data availability. The main insight is that a massive amount of assets (relative to their real economy) is controlled from a few small economies (The Cayman Islands, Bermuda, The Marshall Islands). However, what we can see is likely a lower bound because for most firms in those countries data availability is low. Coincidence?