
Published as Großkurth, P. (2019a) MNE and where to find them: an Intertemporal Perspective on the Global Corporate Ownership Network. Ruhr Economic Papers 825, RWI 10/2019.
The fourth post in this series investigates the evolution of the network over time. Ownership chains are compressed in order to construct a network at the country level. In 2017, this included a total of 2,8M firms controlled by 868,4k GUOs through 1,931M ownership chains. The network is extremely sparse (a few connections are highly frequented – think road network rather than fisher’s net) and increases in density over time. The network’s clustering also increases over time, suggesting that new connections are established close to existing ones. Some direct and indirect connections are disproportionately frequented, suggesting that a closer look in the specific mechanisms could be interesting.
Part 4) Network Evolution
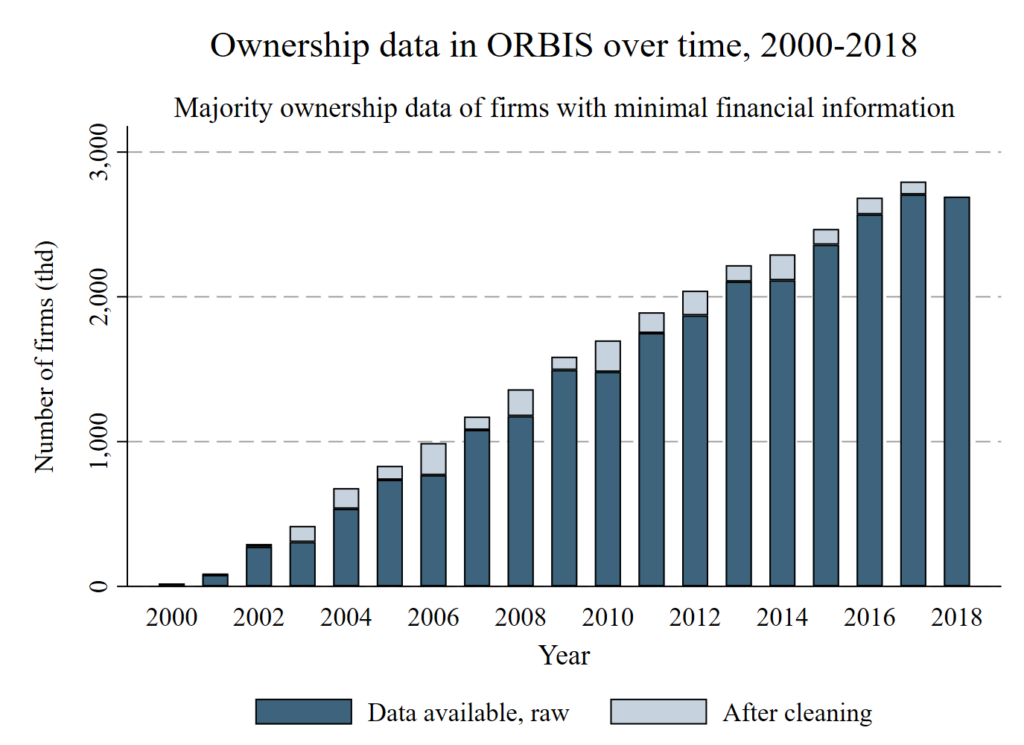
Three features of the dataset are worth a quick discussion before moving on to the network analysis. First, the ownership component of ORBIS has been growing over time at a steady pace. The next figure highlights this. This feature of the database has far-reaching implications for empirical research and is discussed in detail in another paper, Grosskurth (2019b). It’s fairly safe to assume that there were MNE before the year 2000, which means that this increasing trend describes both the growth of the database and the growth of MNE. ORBIS lists ownership connects from the date they enter the database, making it difficult to disentangle the two effects in earlier years. However, this issue declines as ORBIS increases in accuracy, suggesting a a convergence towards a reflection of true MNE growth in later years.
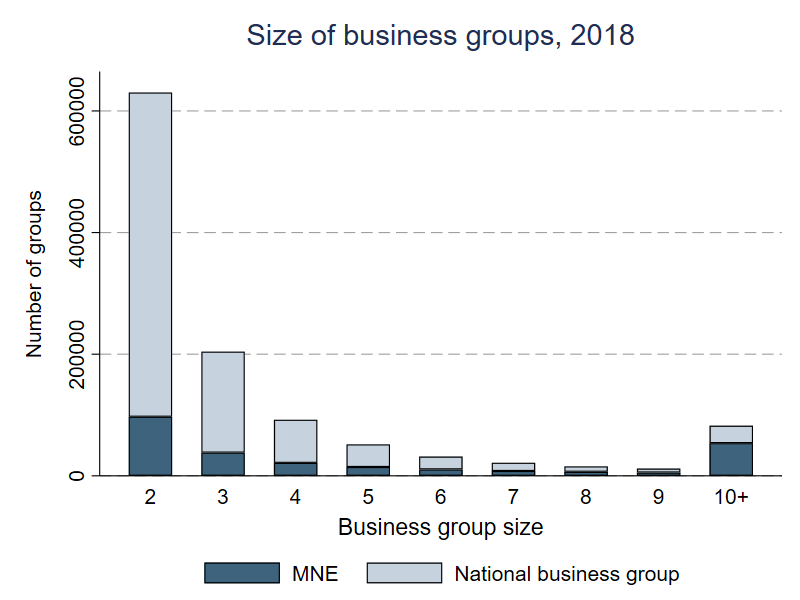
Second, while most of the MNE literature focuses on, well, MNE, they constitute the minority of all business groups. MNE are the predominant type for larger business groups, but not for smaller ones. The figure below highlights this for business groups of different sizes. A business group is just a group of firms which are connected by ownership links, including the simplest case of one controlling and one controlled firm. This definition does not require the ownership link to be international, which means that the identification of business groups alone is not sufficient to identify MNE. This detail should never be overlooked – extracting global ultimate owners (GUO) from ORBIS without additional selection criteria will not return MNE, it will return all business groups. Similarly, defining all groups of firms within national datasets as MNE vastly overestimates their true number.
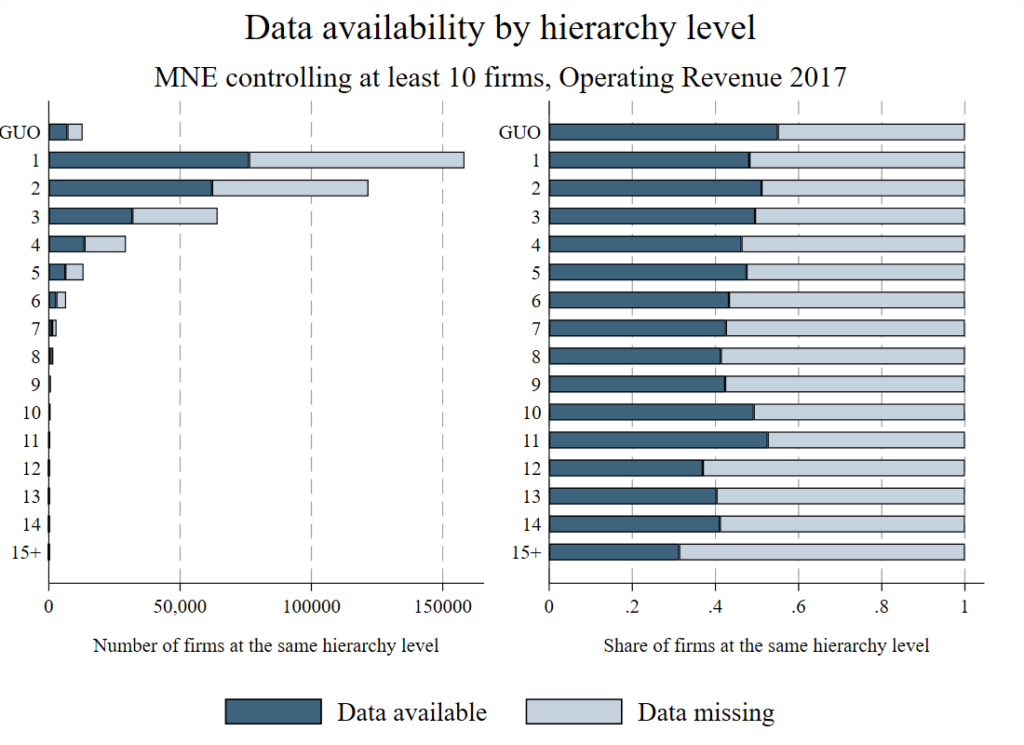
Third, data availability is an issue that needs to be taken into account. Even for a fundamental item such as Operating Revenue, data availability is low. This is neither surprising nor any fault of the database, it’s a logical result of the current state of national filing requirements. However, this means that a reduction to the connections with financial information deletes a substantial share of the network. Previous approaches have proposed solutions to this problem through interpolation, which I reject in favor of getting a few more general insights. Basically, this is more about structural insights into the ownership network than it is about gaining economic insights about the size of the linkages. The figure below highlights why I believe that this increase in generality is warranted.
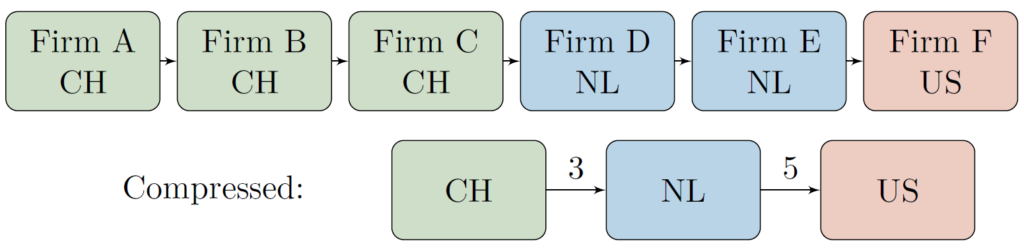
Taken together, the previous three points highlight the need for additional data processing. To build the international network I reduce the data to international connections only and compress the ownership chains (the links between subsidiary and GUO, also through other firms) to the country level. This effectively turns a firm-level data set into a country-level network.
This reduces the complexity of the data and allows for analyses on the country level. Investigating the network at an aggregate level also makes it easier to discern the key patterns.
Macro-level characteristics
The left panel of the next figure illustrates the network’s density as well as degree and strength centralization over time. Given the large number of ownership connections that constitute the foundation of this network, it is extremely sparse. This means that out of all the available connections the firms could have established, only a relatively small amount of routes across countries are actually used. Basically, the network is more akin to a road network than a fisher’s net. The density is slowly increasing over time, suggesting that new connections are added to the network.
The other four measures depicted in the left panel illustrate where these connections are added. Inward and outward degree centralization provide a measure for a network’s internal inequality in terms of the nodes’ connectedness. In this case a high value for inward degree centralization means that a small amount of countries have a lot of (unweighted) connections to other countries while a large amount of countries only have a few. Since inward strength centralization corresponds to the previous measure weighted by the number of firm connections between the countries it can be interpreted as the corporate network’s tendency to accumulate lots of connections on the firm level in a small amount of countries. Taken together this paints the picture of a network where the countries with the largest amounts of connections have remained relatively unchallenged while the firm connections between them are becoming more evenly distributed.
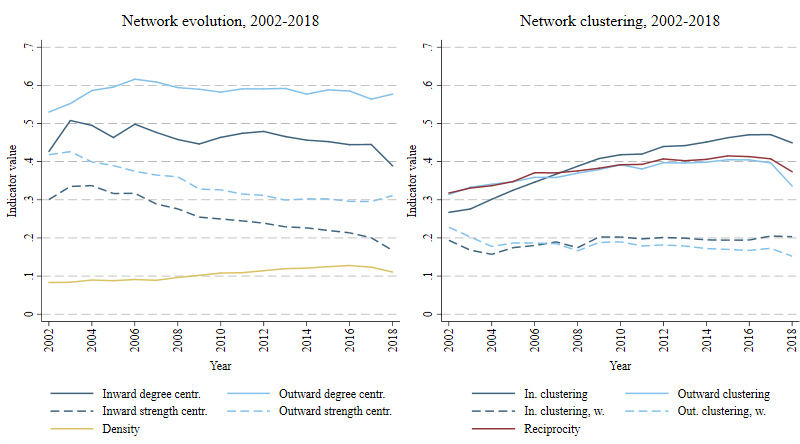
The panel to the right illustrates how this changes the internal structure of the network. The clustering coefficients measure the countries’ tendency to appear close to each other in the network, either inward (countries with a lot of controlling connections to other countries group together) or outward (countries which are controlled by many other countries group together). Similar to their centralization counterparts, the weighted forms take the number of firm connections between countries into account. The result illustrates that countries of both previously outlined types are moving closer to each other over time, but the countries with a controlling influence do so at a faster rate. The more balanced addition of firm connections between them keeps the weighted clustering coefficients relatively stable over time. Finally, the network’s reciprocity measure closely follows the outward clustering coefficient. This highlights that new connections are also added in the opposite direction of existing connections, making the network more reciprocal over time.
Micro-level insights
While the previous section provided an overview of the network’s evolution on a macro level, the changes on the micro level are both easier to understand and more interesting in terms of their policy implications. The next figure prints the top direct connections between countries, the “highways” of the ownership network.
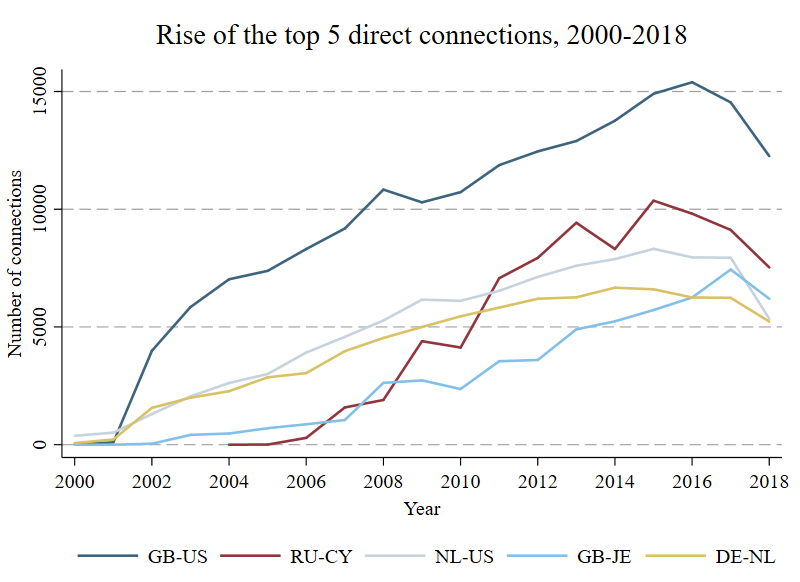
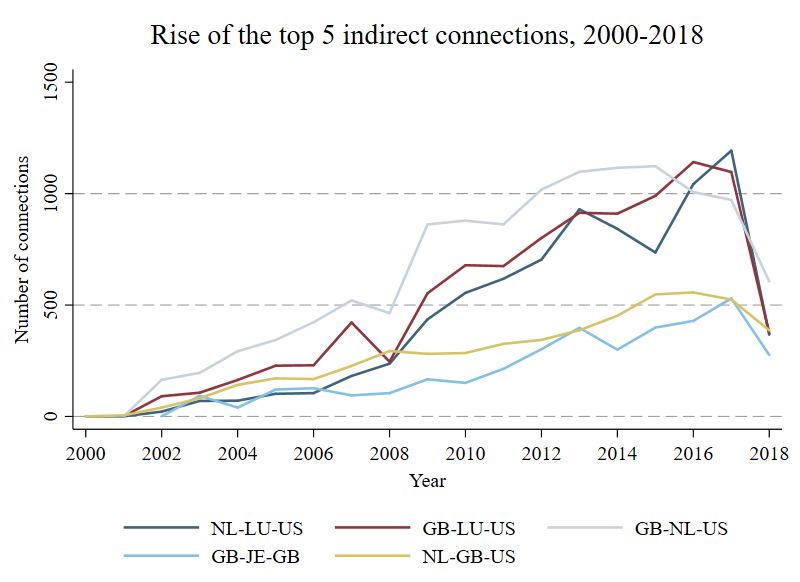
The connection between the United Kingdom and the United States is unsurprisingly the most frequented one, but the meteoric rise of the connection between Russia and Cyprus is peculiar. Investigating the motivations for these developments inevitably points towards the countries’ tax codes, a journey that would exceed the space of this paper. A closer look at the most frequented indirect connections, however, reinforces this conclusion. The top five indirect connections are all variations of links between five countries (four if Jersey is grouped with the UK).
The results have significant implications for policy makers. In the absence of a global regulatory consensus, corporate structures engineered as vehicles for aggressive tax planning could be identified easily by using this method. Even in the absence of financial information, this would help to tailor regulation to the most impactful connections in the network.