Published as Großkurth, P. (2019b) Dynamic Structure – Dynamic Results? Re-estimating Profit Shifting with Historical Ownership Data. Ruhr Economic Papers 811, RWI 6/2019.
The second important lesson that I learned from my PhD was that one should prioritize based on expectations. In practice that means two things. On the positive side, on should invest time into projects that have a large expected payoff (with is often the case for projects with a rather low probability of success, the “moon shots”). On the negative side this means making damn sure that a crucial assumption that holds the entire paper together does not fail easily. Or that a problem with potentially massive repercussions gets investigated with priority.
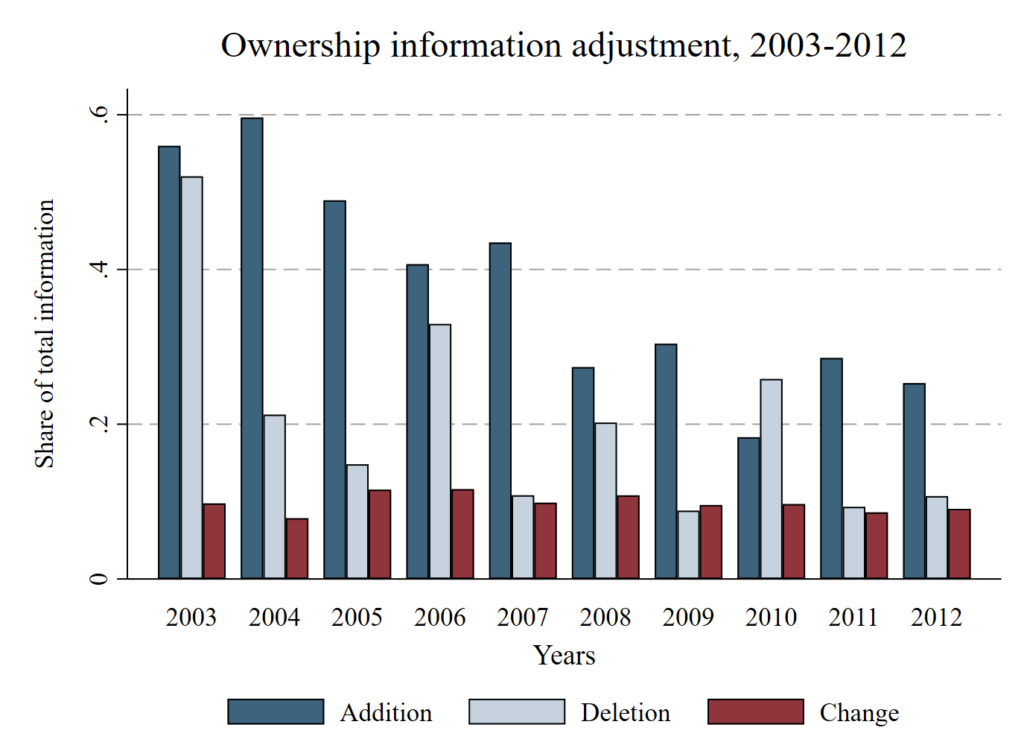
The second paper of my dissertation digs into the details of the “constant ownership assumption”, which is made by many empirical papers on MNE. Although it’s neither likely nor convincing to assume that business structures don’t change over time, making this heroic assumption is a great deal easier than working through the alternatives. Many researchers simply did not have access to the necessary data to do it in any other way either. Fortunately (or unfortunately, looking back at my own publication output) I did have access to this data. The main problem can be seen in the following figure:
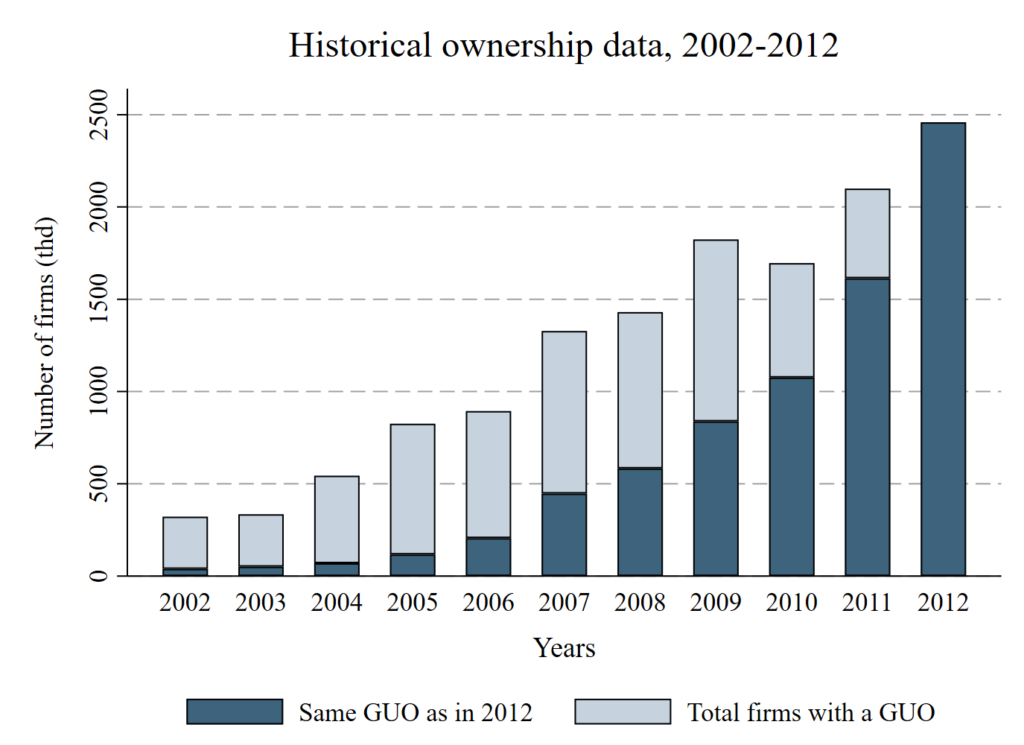
The structural data is nowhere near constant. It changes in every year at an average rate of around 9 percent. As one would expect. For the panel this means that the share of data that fulfills the assumption of constant ownership is practically nonexistent in later years:
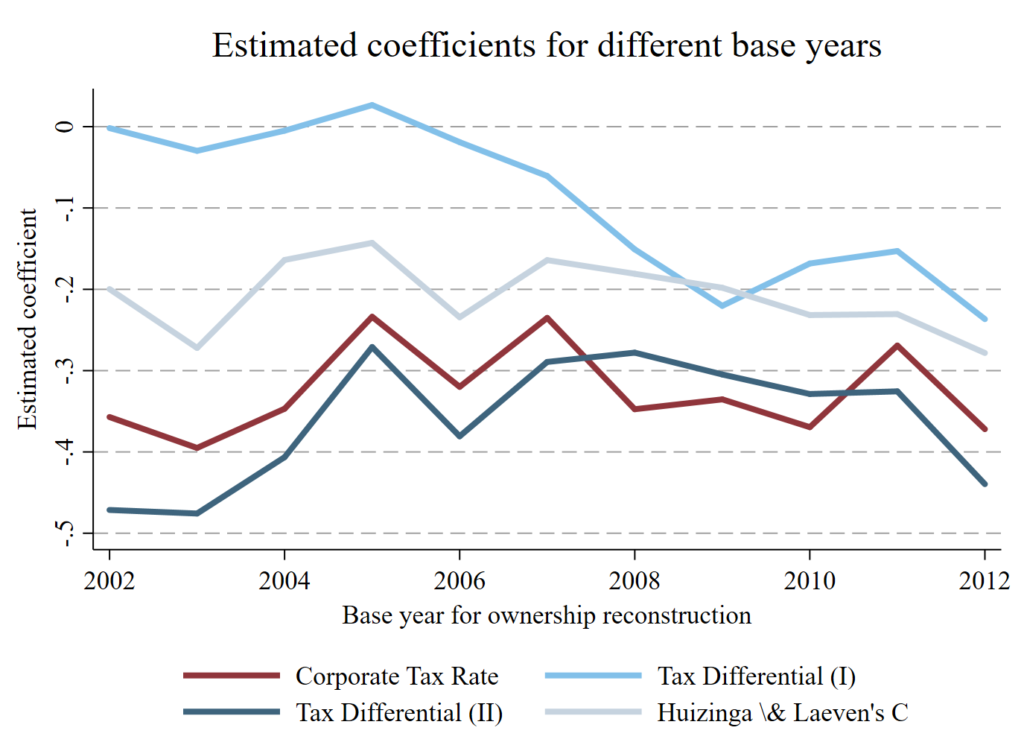
What does this mean in practice? I investigated some simple estimations of profit-shifting and found that the coefficients can change if the underlying sample is changed based on the ownership data structure.
Future research on MNE could benefit from additional robustness checks that take varying ownership structures into account, because this effect might be of different relevance for different questions. As can be seen above, different indirect measures of profit shifting have different sensitivities to changes of the structural data. This could be a problem in other studies, but does not have to be.
What is a problem is that this was the first paper to check an assumption that an entire stream of the literature is built upon.
Abstract:
Ownership structures of multinational enterprises are commonly assumed to remain constant over time, both due to a lack of easily accessible panel data and to facilitate empirical analyses. This paper discusses the validity of this assumption and assesses its relevance in the context of profit shifting. A new method of reconstructing historical ownership information in Bureau van Dijk’s ORBIS database reveals a highly dynamic environment. The validity of the assumption collapses with increasing panel length; ownership structures are rarely constant over time. Moreover, about 9 percent of firms with observed ownership data change owners in each year. The relevance of the assumption is tested by re-estimating indirect measures of profit shifting for selected benchmark samples. Assuming ownership structures as constant has a strong impact on sample composition, adding almost 29 percent of additional observations compared to historical ownership data. In the context of profit shifting, estimates based on constant ownership data are found to be larger in absolute magnitude compared to estimates based on historical ownership data.
Published as Großkurth, P. (2019a) MNE and where to find them: an Intertemporal Perspective on the Global Corporate Ownership Network. Ruhr Economic Papers 825, RWI 10/2019.
The main lesson from the third paper of my dissertation is that complexity does not have to be complicated. The paper proposes a new way of visualizing MNE (Multinational Enterprises) ownership structures in the form of ownership maps, investigates MNE structure and strategies and describes the evolution of the global ownership network. In hindsight I packed a few things too many into this paper, which I am attempting to remedy here by splitting it up into several posts.
Part 1) Ownership maps
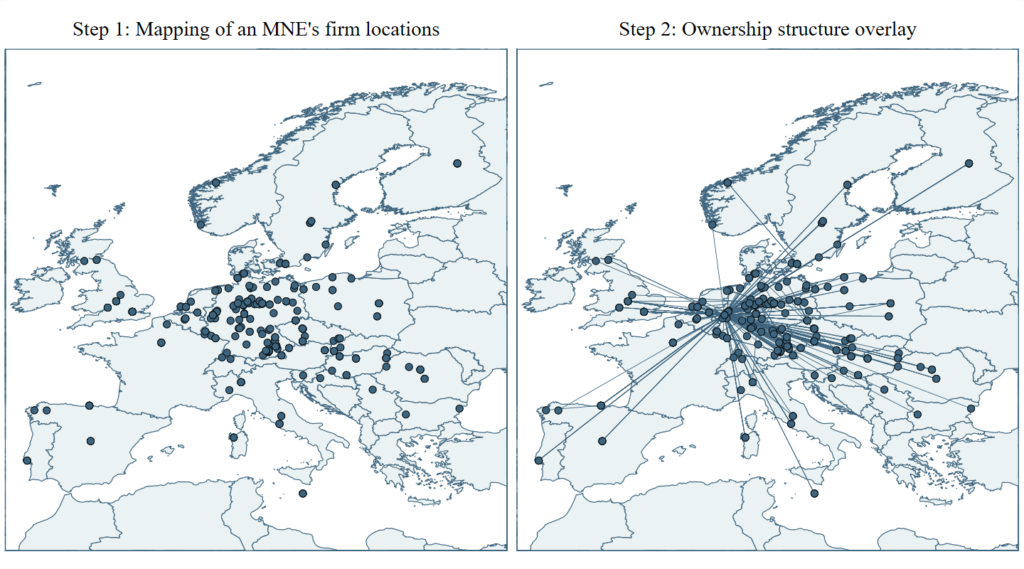
I have a hard time understanding things that I can’t visualize. MNE, however, are extraordinarily complex entities. Every attempt to print them becomes a negotiation between clarity and accuracy. For example, the image below on the left side prints all firms connected in one (!) MNE onto a map of Europe according to their geographic location. Since there is no aggregation of any kind, multiple firms in the same location disappear on top of each other – the visual impression sacrifices some clarity.
However, full accuracy is needed for the second step: the overlay of ownership information. This is essentially an entity-relationship-diagram of the firm-level data printed on top of the previous image. Each line connects two firms whenever one firm owns another. The result is an intuitive visualization of the MNE’s ownership structure, which can then be used for further visual analysis.
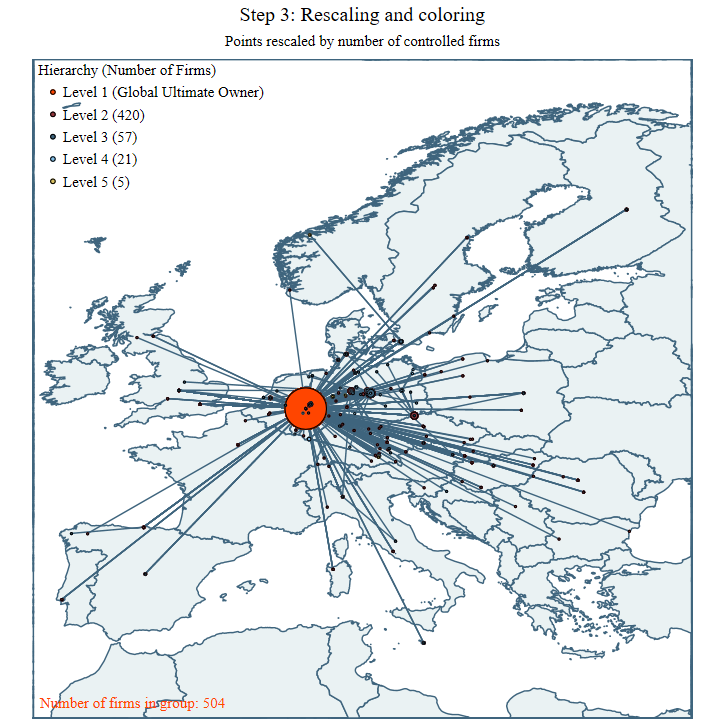
The figure can be further enriched with additional data; pretty much anything that’s available on any level of the MNE. One option shown below is to scale each point according to the number of firms that are connected by it. This representation allows for the visual distinction of regional hubs and headquarters, but pretty much anything is possible.
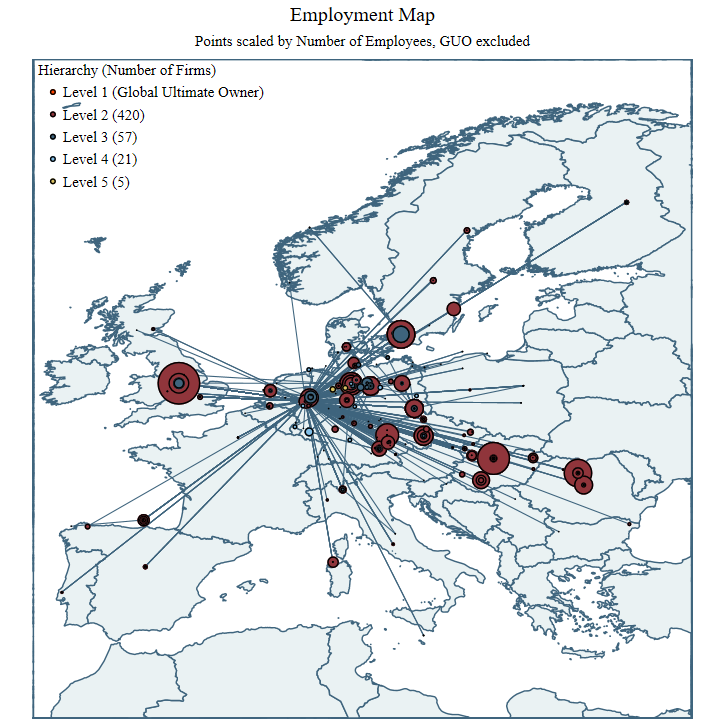
For example, scaling the points by a different variable, the number of employees per company, reveals the employment profile of a company.
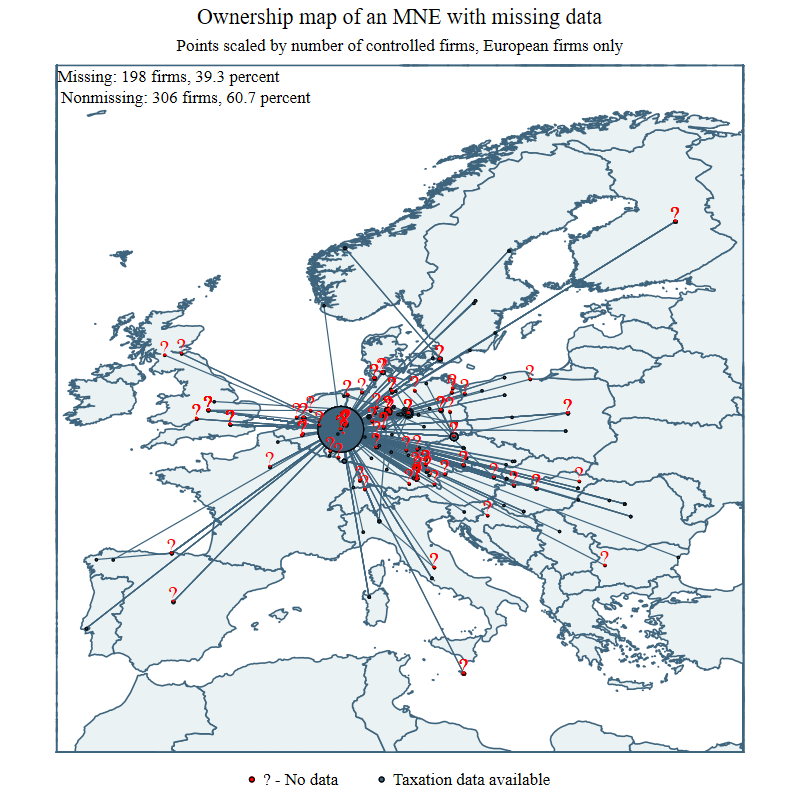
The possibilities for these visualization are only limited by the availability of data, but even that might be valuable information in some cases:
Turns out for many of these firms data on taxation was not available. Even more information could be displayed in the same figure through a color gradient of the points and lines, line thickness, and certainly through the application of some kind of aggregation.
Ownership maps simplify MNE to a level where it becomes possible to understand them better. It was a great journey to work on this.
Abstract:
This paper introduces a simple procedure to construct ownership maps in Stata, uses a new method to map the development of the global network of multinational business groups over time and investigates the development of core components of the network. Based on Bureau van Dijk’s ORBIS database, a full panel of ownership structures from 2000-2018 is reconstructed. The data is subjected to a descriptive analysis and subsequently used to identify key locations within the network. Ownership structures are used to identify outliers in the network even in the absence of financial data on the firm level. The identified locations largely overlap with results in the literature, but also point towards previously overlooked destinations. The aggregate ownership network at the country level is used to provide an intertemporal perspective on countries’ development paths within the global network of multinational companies and sheds new light on MNE’s expansion paths.
Published as Großkurth, P. (2019a) MNE and where to find them: an Intertemporal Perspective on the Global Corporate Ownership Network. Ruhr Economic Papers 825, RWI 10/2019.
The second post in this series digs deeper into the structure and characteristics of the global ownership network. The data extraction and preparation process for this paper was extensive, drawing upon the lessons learned in the previous two papers. In a nutshell I extracted the entire ownership network once more, this time during a research visit at the Centre for International Environmental Studies of the Graduate Institute Geneva. I reconstructed the data from 2000-2018 with a base sample of 27.710 million firms, once again reconstructing the ownership connections with a bottom-up approach.
Part 2) Control and Connectedness
The result is a unique dataset which grants fascinating insights into the global economy. Well, those parts that made it into the ORBIS database, at least. The data opens up many interesting avenues for research.
For example, each firm is listed with a specific code number which includes the 2-digit ISO country code. Aggregating the network to the country level and taking into account the direction of the ownership links then allows to investigate which countries host firms who control firms in other countries (below, on the Y-axis) and which ones host firms controlled by firms located in other countries (below, on the X-axis).
While the US and Japan are primarily outward-oriented, Germany exhibits a more balanced profile. Furthermore, most high-income countries are well connected in both directions. Openness is key to growth and development in a strongly connected global economy.
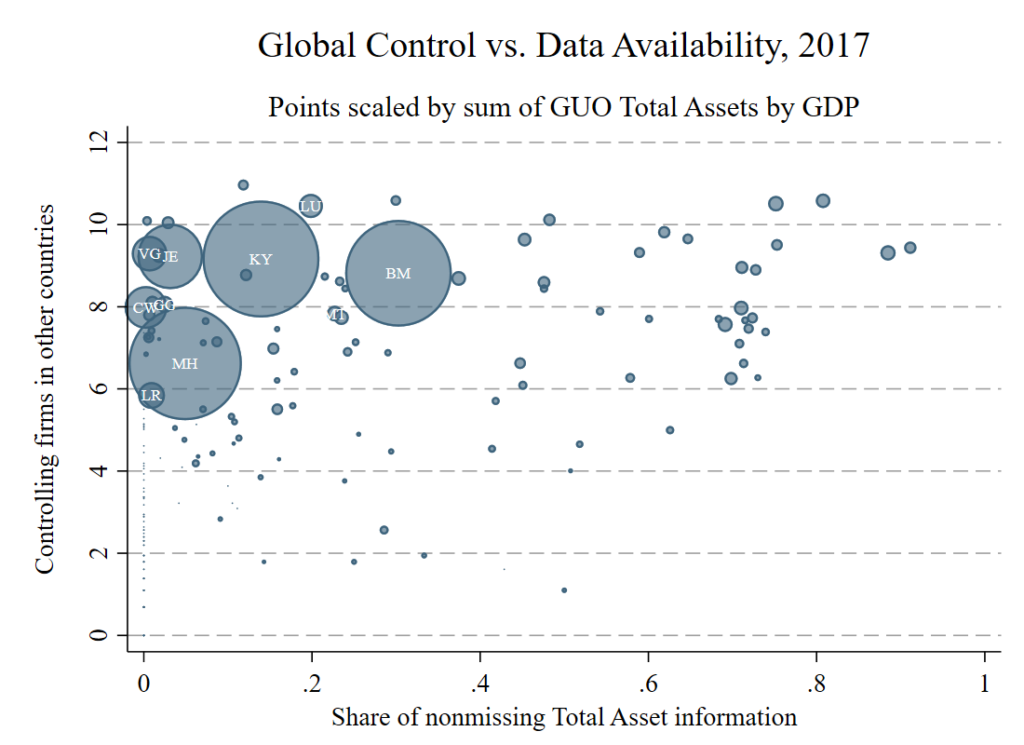
Another insight on the country level can be gained by investigating the outliers of the global ownership network. The figure below keeps the same Y-axis out outward form control, but scales the size of the points by the ratio of controlled assets to GDP and replaces the X-axis with a measure of data availability. The main insight is that a massive amount of assets (relative to their real economy) is controlled from a few small economies (The Cayman Islands, Bermuda, The Marshall Islands). However, what we can see is likely a lower bound because for most firms in those countries data availability is low. Coincidence?
Published as Großkurth, P. (2019a) MNE and where to find them: an Intertemporal Perspective on the Global Corporate Ownership Network. Ruhr Economic Papers 825, RWI 10/2019.
The third post in this series investigates MNE growth and strategy, highlighting organizational preferences and spatial growth over time. There are common patterns: the average MNE is small, organized as flat as possible, and connects few countries. Internationalization, however, can happen in very different ways. As long as an MNE has subsidiaries in only a few countries, both flat and deep hierarchical structures are employed. On average and for larger numbers of connected countries, MNE seem to converge towards flatter hierarchiers. Growth, on the other hand, happens either very slow (expansion – the creation of new subsidiaries) or extremely fast (combination – M&A and the like).
Part 3) Growth and Strategy
Is it possible to accurately print the time series data of 329.376 MNEs? The next figure tries to do exactly this, overlaying the expansion paths of all MNE in my dataset both in terms of the countries and the firms they connect. To make the average pattern visible, I reduced the opacity of the individual lines into the single digits. The way Stata handles overlapping lines then brings out the average. Probably not a perfect solution, but good enough to understand what’s going on in this massive dataset.
Both panels of the figure also highlight the large amount of fluctuation in the data – if a line jumps unreasonably from one year to the next it’s fairly safe to assume that something fundamental has happened to either the firm or the way the firm is captured in the database. The results suggest that most MNE stay small and regional, a point that the next figure will clear up even further.
A key insight here is that the average MNE is much smaller than their reputation suggests and that MNE grow faster in terms of the number of connected firms than they do in terms of the number of connected countries.
In each year firms enter the dataset and firms leave it, which explains the difference between the panels in the figure above. On the left side averages are calculated in each year of the database. Due to the large turnover of firms, the average size of an MNE – both in terms of the connected firms as well as the connected countries – seems to stagnate. If the data is rearranged, however, to align firms according to the number of years that we observe them in the dataset, the picture is strikingly different. Firms grow in both dimensions and they grow considerably. The fluctuations at the end of the figures are explained by input lag on the left side and reduced data availability of firms with long time series on the right.
However, while this suggests that firms grow over time it’s important to keep in mind the ever present process of creative destruction. Most firms aren’t observed continuously and data availability grew over time. Taking this into account, the next figure highlights the massive turnover of firms.
In this case what’s true for firms in general also seems to be true for MNE in particular. The data also points toward a process of group size consolidation over time, but that’s a story for another time.
Aside from these more general conclusions the dataset also allows for an in-depth investigation of the MNEs’ organizational structures and strategies. The figure below highlights the relationship between group size, connected countries, and hierarchy depth (the number of links between the global ultimate owner and the furthest removed subsidiary in the group). What’s immediately striking is how slow the average rate of geographical expansion is. The Y-Scale is at a factor of about 1/10 of the X-Scale, meaning that MNE generally increase the number of subsidies in a country they are active in before they move to another. Likewise, MNE favor flat hierarchies over deep ones (aside from a few outliers who only operate in relatively small numbers of countries), a result that doesn’t seem to change all that much with increasing group size.
Published as Großkurth, P. (2019a) MNE and where to find them: an Intertemporal Perspective on the Global Corporate Ownership Network. Ruhr Economic Papers 825, RWI 10/2019.
The fourth post in this series investigates the evolution of the network over time. Ownership chains are compressed in order to construct a network at the country level. In 2017, this included a total of 2,8Mfirms controlled by 868,4k GUOs through 1,931M ownership chains. The network is extremely sparse (a few connections are highly frequented – think road network rather than fisher’s net) and increases in density over time. The network’s clustering also increases over time, suggesting that new connections are established close to existing ones. Some direct and indirect connections are disproportionately frequented, suggesting that a closer look in the specific mechanisms could be interesting.
Part 4) Network Evolution
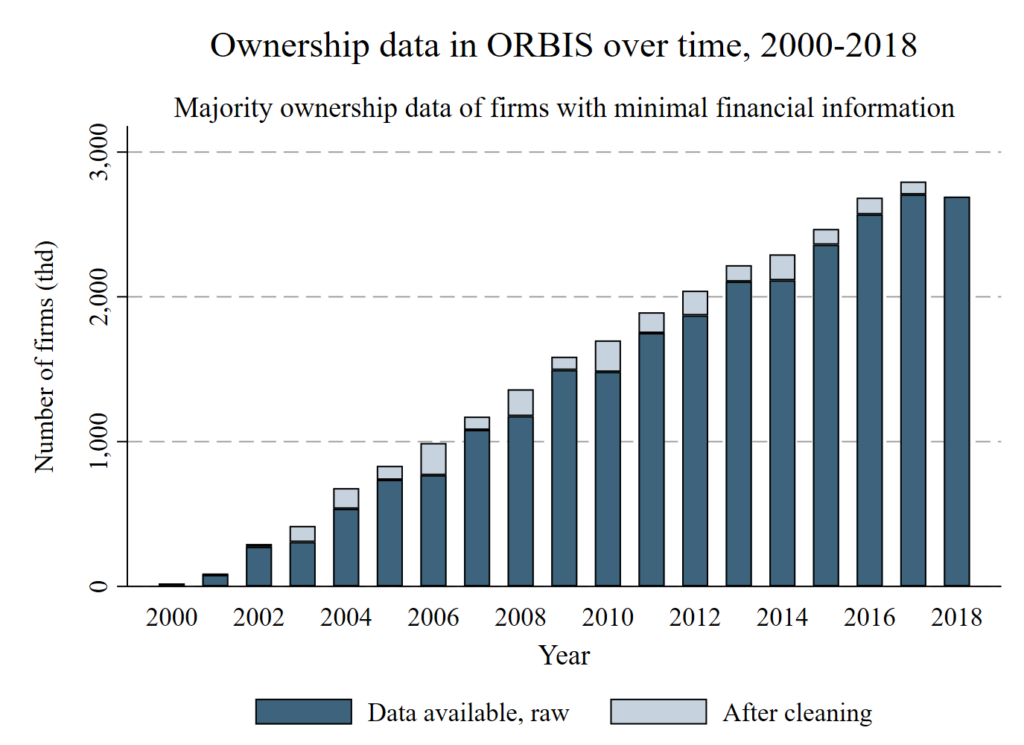
Three features of the dataset are worth a quick discussion before moving on to the network analysis. First, the ownership component of ORBIS has been growing over time at a steady pace. The next figure highlights this. This feature of the database has far-reaching implications for empirical research and is discussed in detail in another paper, Grosskurth (2019b). It’s fairly safe to assume that there were MNE before the year 2000, which means that this increasing trend describes both the growth of the database and the growth of MNE. ORBIS lists ownership connects from the date they enter the database, making it difficult to disentangle the two effects in earlier years. However, this issue declines as ORBIS increases in accuracy, suggesting a a convergence towards a reflection of true MNE growth in later years.
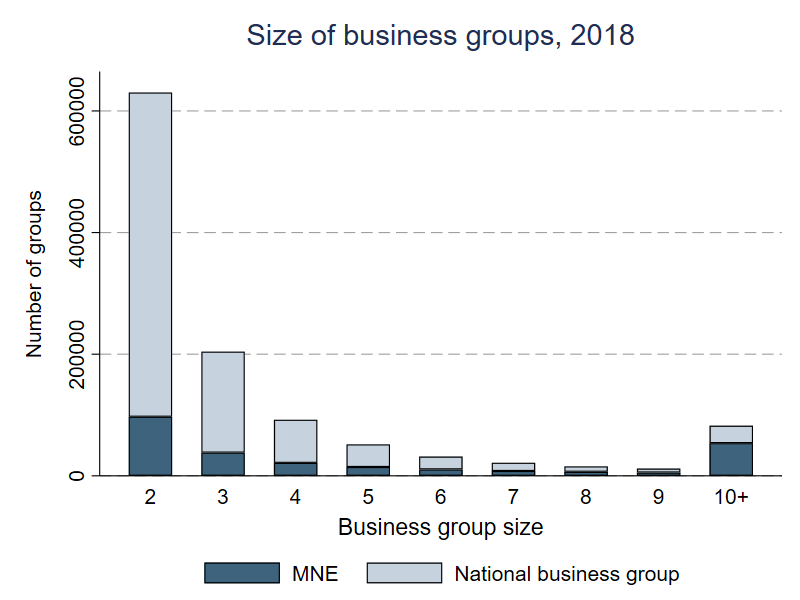
Second, while most of the MNE literature focuses on, well, MNE, they constitute the minority of all business groups. MNE are the predominant type for larger business groups, but not for smaller ones. The figure below highlights this for business groups of different sizes. A business group is just a group of firms which are connected by ownership links, including the simplest case of one controlling and one controlled firm. This definition does not require the ownership link to be international, which means that the identification of business groups alone is not sufficient to identify MNE. This detail should never be overlooked – extracting global ultimate owners (GUO) from ORBIS without additional selection criteria will not return MNE, it will return all business groups. Similarly, defining all groups of firms within national datasets as MNE vastly overestimates their true number.
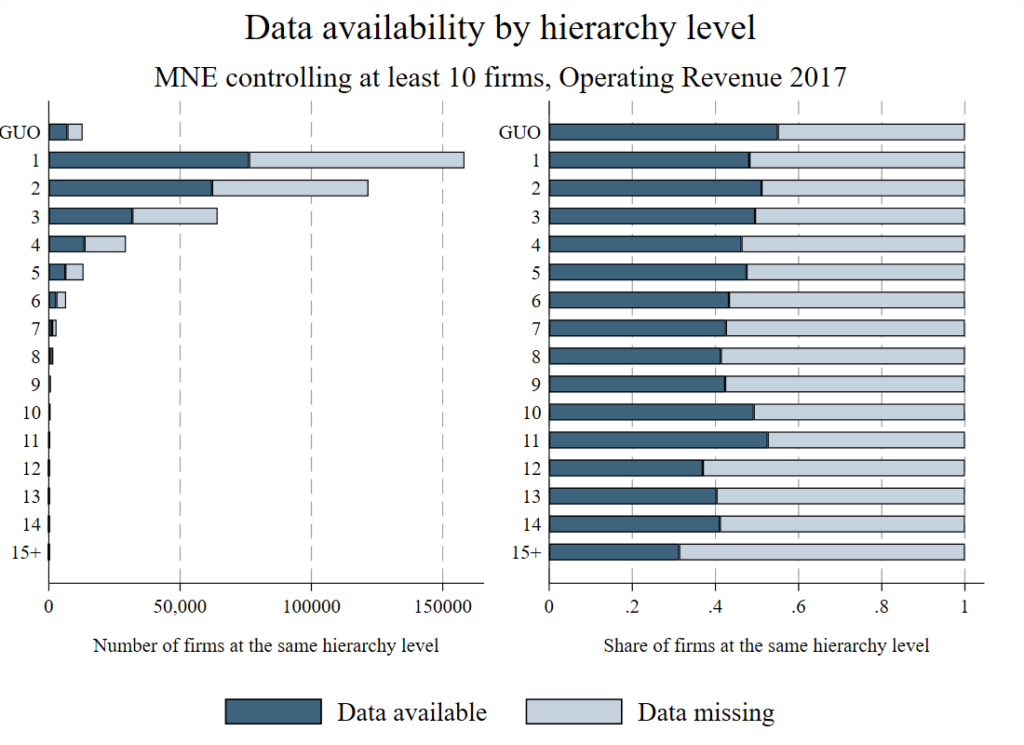
Third, data availability is an issue that needs to be taken into account. Even for a fundamental item such as Operating Revenue, data availability is low. This is neither surprising nor any fault of the database, it’s a logical result of the current state of national filing requirements. However, this means that a reduction to the connections with financial information deletes a substantial share of the network. Previous approaches have proposed solutions to this problem through interpolation, which I reject in favor of getting a few more general insights. Basically, this is more about structural insights into the ownership network than it is about gaining economic insights about the size of the linkages. The figure below highlights why I believe that this increase in generality is warranted.
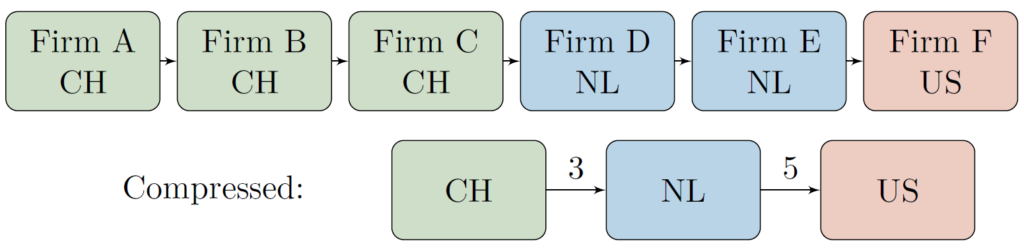
Taken together, the previous three points highlight the need for additional data processing. To build the international network I reduce the data to international connections only and compress the ownership chains (the links between subsidiary and GUO, also through other firms) to the country level. This effectively turns a firm-level data set into a country-level network.
This reduces the complexity of the data and allows for analyses on the country level. Investigating the network at an aggregate level also makes it easier to discern the key patterns.
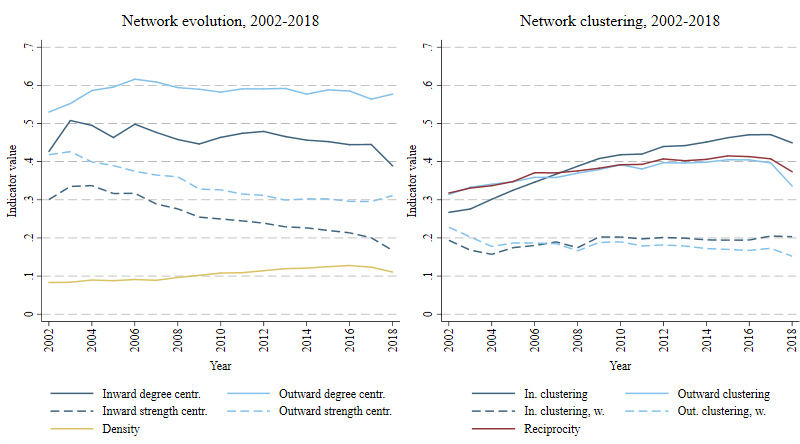
Macro-level characteristics
The left panel of the next figure illustrates the network’s density as well as degree and strength centralization over time. Given the large number of ownership connections that constitute the foundation of this network, it is extremely sparse. This means that out of all the available connections the firms could have established, only a relatively small amount of routes across countries are actually used. Basically, the network is more akin to a road network than a fisher’s net. The density is slowly increasing over time, suggesting that new connections are added to the network.
The other four measures depicted in the left panel illustrate where these connections are added. Inward and outward degree centralization provide a measure for a network’s internal inequality in terms of the nodes’ connectedness. In this case a high value for inward degree centralization means that a small amount of countries have a lot of (unweighted) connections to other countries while a large amount of countries only have a few. Since inward strength centralization corresponds to the previous measure weighted by the number of firm connections between the countries it can be interpreted as the corporate network’s tendency to accumulate lots of connections on the firm level in a small amount of countries. Taken together this paints the picture of a network where the countries with the largest amounts of connections have remained relatively unchallenged while the firm connections between them are becoming more evenly distributed.
The panel to the right illustrates how this changes the internal structure of the network. The clustering coefficients measure the countries’ tendency to appear close to each other in the network, either inward (countries with a lot of controlling connections to other countries group together) or outward (countries which are controlled by many other countries group together). Similar to their centralization counterparts, the weighted forms take the number of firm connections between countries into account. The result illustrates that countries of both previously outlined types are moving closer to each other over time, but the countries with a controlling influence do so at a faster rate. The more balanced addition of firm connections between them keeps the weighted clustering coefficients relatively stable over time. Finally, the network’s reciprocity measure closely follows the outward clustering coefficient. This highlights that new connections are also added in the opposite direction of existing connections, making the network more reciprocal over time.
Micro-level insights
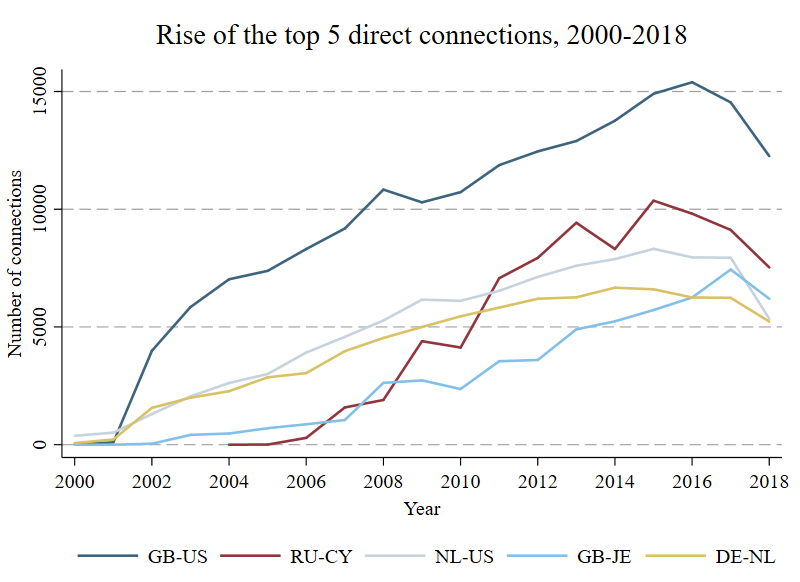
While the previous section provided an overview of the network’s evolution on a macro level, the changes on the micro level are both easier to understand and more interesting in terms of their policy implications. The next figure prints the top direct connections between countries, the “highways” of the ownership network.
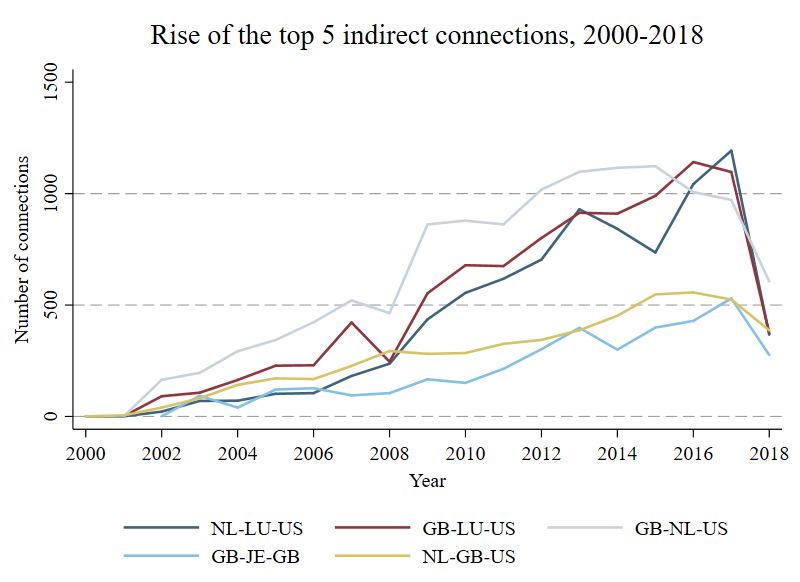
The connection between the United Kingdom and the United States is unsurprisingly the most frequented one, but the meteoric rise of the connection between Russia and Cyprus is peculiar. Investigating the motivations for these developments inevitably points towards the countries’ tax codes, a journey that would exceed the space of this paper. A closer look at the most frequented indirect connections, however, reinforces this conclusion. The top five indirect connections are all variations of links between five countries (four if Jersey is grouped with the UK).
The results have significant implications for policy makers. In the absence of a global regulatory consensus, corporate structures engineered as vehicles for aggressive tax planning could be identified easily by using this method. Even in the absence of financial information, this would help to tailor regulation to the most impactful connections in the network.